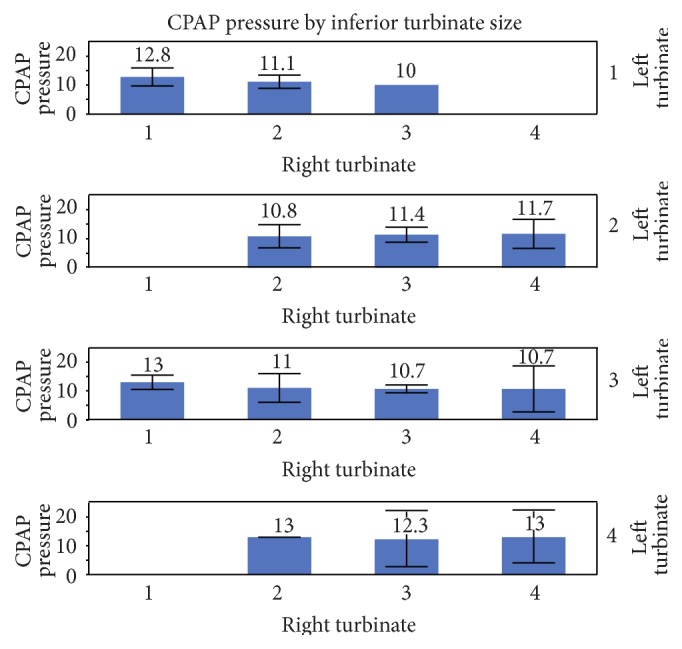
Figure 2.

Mean diagnostic CPAP by inferior turbinate size (grades 1–4). Each error bar is constructed using a 95% confidence interval of the mean. Multivariate analysis with Standard Least Squares Linear Regression Model shows R 2 = 0.08, p value = 0.9953 consistent with no association to very weak association between CPAP and inferior turbinate size.
