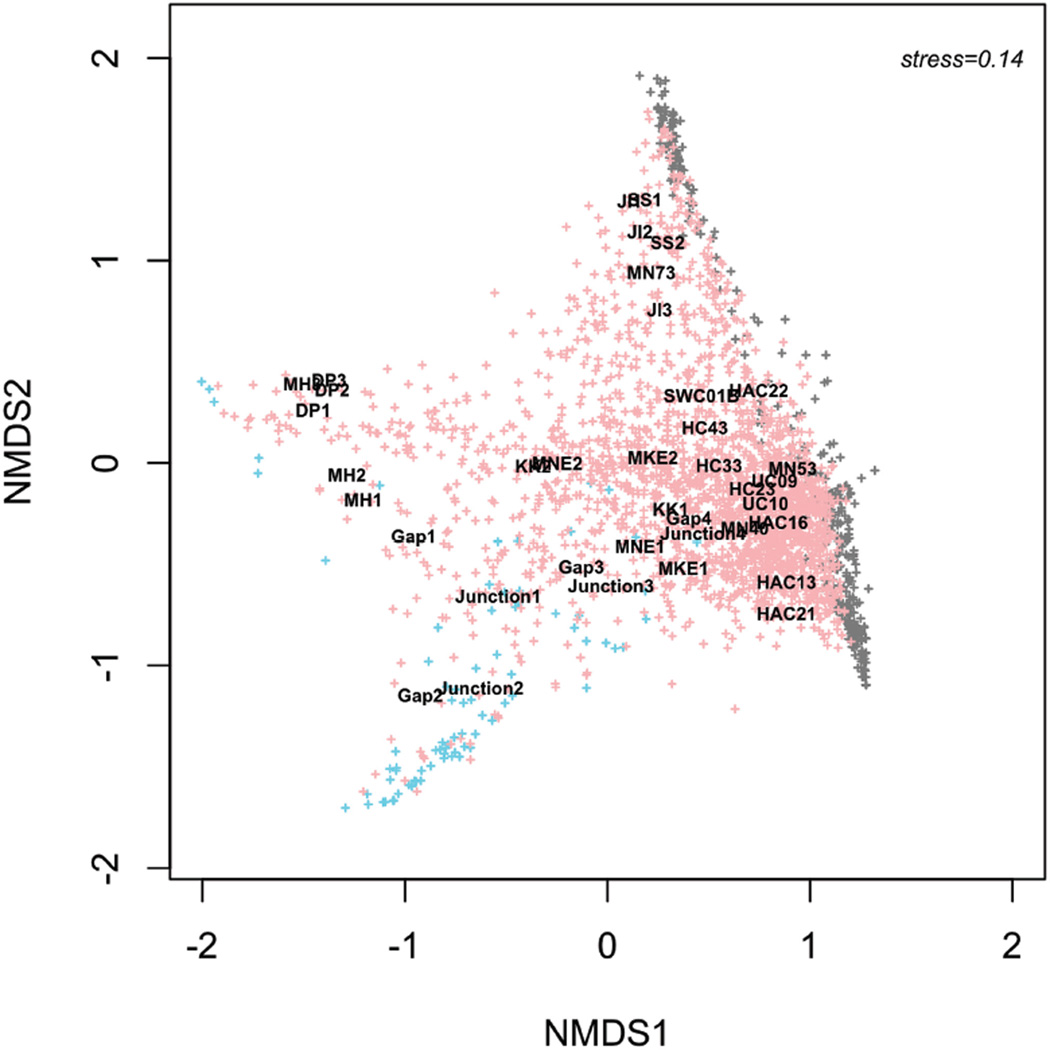
Figure 6. Distribution of OTUs from urban signature taxa and percent urban signature in aquatic environments.
Sequence-based analysis of 104 taxa within the urban infrastructure signature (stormwater taxa + nonfecal sewage taxa) identified 2,746 OTUs from over 8 million sequences; some OTUs were found exclusively in either urban (427; shown in grey) or aquatic (80; shown in blue) environments, but 2239 OTUs were found in both (pink). NMDS ordination of individual samples based on OTUs is overlaid to show how OTUs distributed in relation to samples and environments.
doi: 10.12952/journal.elementa.000064.f006

