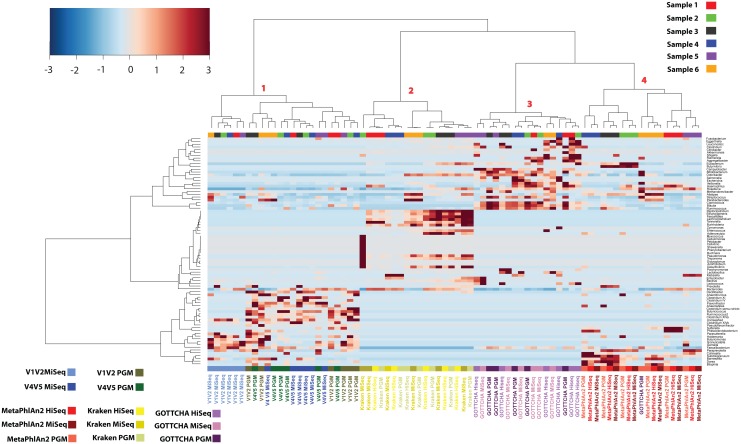
Fig 1. Heat-plot representing the taxonomic composition of the samples at genus level.
The heat-plot also includes amplicon data long shotgun datasets from three classifiers namely: MetaPhlAn2, Kraken and GOTTCHA. Only genera in a minimum of 20% of datasets were retained. The method of correlation used was Spearman along with Ward D2 Clustering (PGM = Ion Personal Genome Machine).

