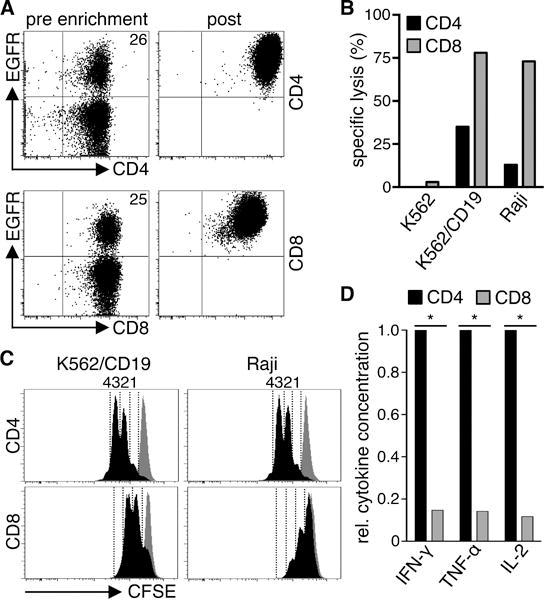
Figure 2. CD4+ and CD8+ CAR-T-cells differ in effector function.

(A) Expression of EGFRt on CD4+ and CD8+ T-cells transduced with a CD19 CAR-EGFRt construct before enrichment (pre) and after enrichment and expansion (post). (B) Cytolytic activity of CD19 CAR-T-cells against 51Cr-labeled CD19+ (K562/CD19, Raji) and control (K562) target cells at an E:T ratio of 30:1 analyzed by a standard 4 h chromium release assay. (C) Proliferation of CFSE-labeled CD19 CAR-T-cells after stimulation with K562/CD19 and Raji cells for 72 h measured by CFSE dye dilution. Stimulation of CFSE-labeled CD19 CAR-T-cells with CD19− K562 cells is shown as a comparison in each histogram (gray graph). Numbers above each histogram indicate the number of cell divisions the proliferating subset underwent. Data in A–C are representative of experiments with CAR-T-cells derived from three different donors. (D) Relative cytokine production by CD19 CAR-T-cells after co-culture with K562/CD19 and Raji cells for 24 h. Data from three independent experiments with T-cells prepared from different donors were combined. Cytokine production of CD4+ cells was set as 1 and relative cytokine production of CD8+ T-cells was calculated. Asterisk indicates significant differences between CD4+ and CD8+ cells.
