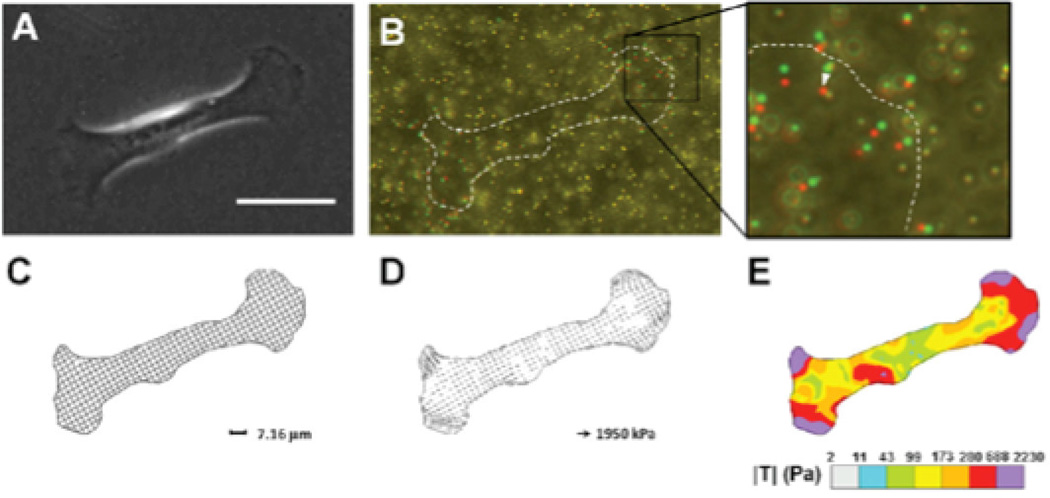
Figure 2. Traction Force Microscopy.
A) Phase contrast image of a mammary epithelial cell on a polyacrylamide gel with fiducial microbeads. Scale bar 50 µm. B) Composite image of microbeads during cell force generation (red) and after removing the cell from the substrate with trypsin (green). C) Discretized mesh of cell area defines the region of interest for traction calculation. D) Traction stresses calculated across the mesh. E) Color contour plot visualizes the distribution of traction stresses under the cell. Reproduced with permission from [42]

