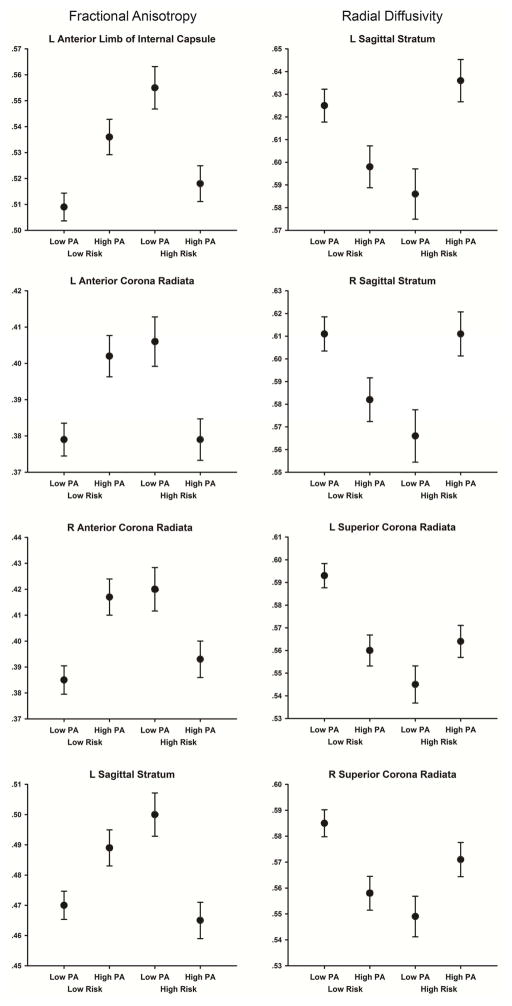
Figure 2.
(Left) Fractional anisotropy in the four groups of participants within the four WM tracts that had the largest Risk × PA interaction effects. (Right) Radial diffusivity (mm2/sec) in the four groups of participants within the four WM tracts that had the largest Risk × PA interaction effects. Error bars are the SEM.

