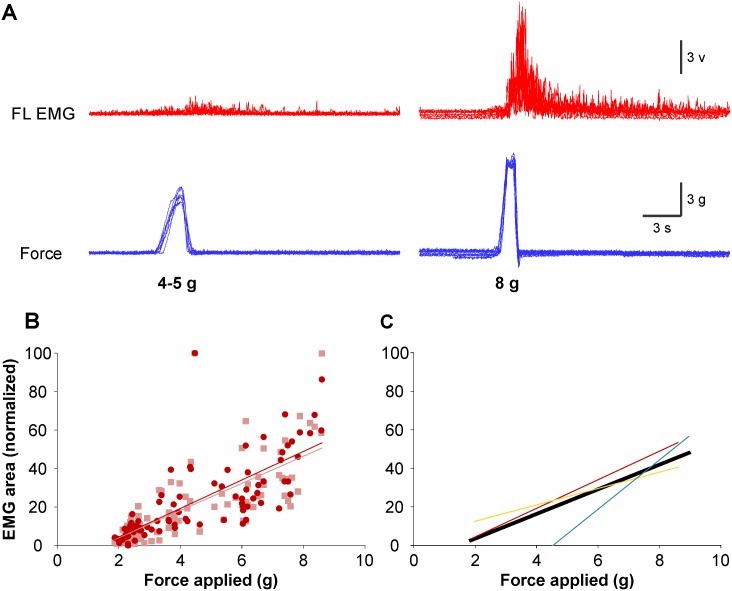
Fig 4. Arm extensor responses in relation to force stimulation.
(A) EMG responses (red) of the triceps to pressures (blue) of 4–5 g or 8 g applied on the snout in one specimen. In this example, seven EMG and force traces are superimposed. (B) Ipsilateral (dark) and contralateral (pale) triceps responses (% EMG area, normalized) according to the strength of the force (g) applied to the snout of one specimen. (C) Correlation analysis for the 3 specimens tested in this series of experiment. Each color represents the regression line based on data recorded for each given specimen and the black line represents the regression line for all 3 specimens.

