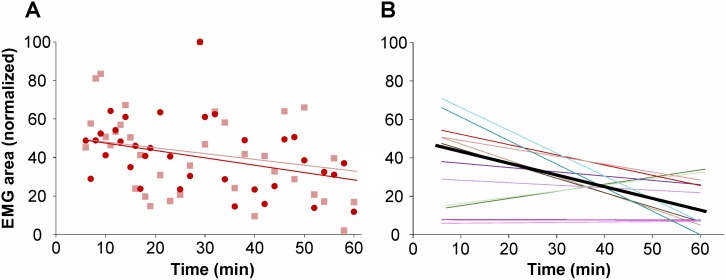
Fig 5. Triceps responses evoked by mechanical stimulation of the facial skin over time.
(A) Responses (% EMG area, normalized) during 60 min. of stimulation in one specimen. (B) Correlation analysis for the 6 specimens tested. Each pair of colors, dark and light, represents the regression lines of the ipsi- and contralateral triceps of each given specimen and the black line is the average.

