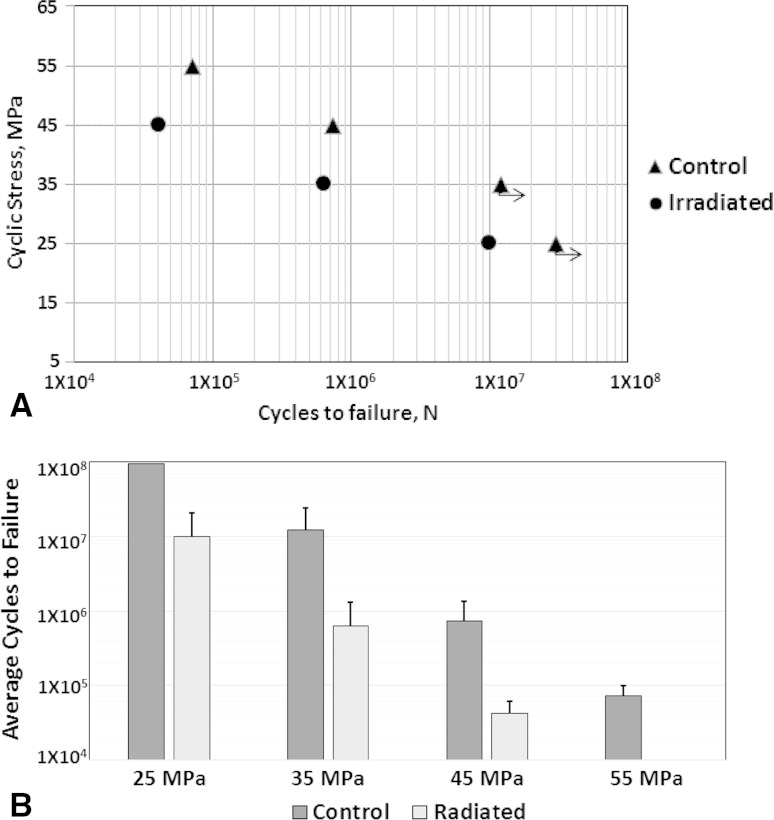
Fig. 2A–B.
(A) The mean cycles to failure for all treatment groups at stress levels of 45, 35, and 25 MPa are shown. The SD bars are not shown for clarity. The arrows emanating from the control group at 25 MPa indicate multiple run-outs, and 35 MPa indicates one run-out sample. For this study, run-out was set at 30 million cycles. At 25 MPa most of the control samples were run-outs. Therefore, to get the mean failure cycle at another stress level, a 55 MPa group was added to the control group. (B) The mean cycles to failure for the treatment groups at different stress levels are shown. The error bars show the SD. For the control group at 25 MPa, five of six samples were run-outs, therefore, the mean and SD are not provided and the bar plot reaches the maximum limit. (n = 6 samples [except for 55 MPa, n = 5 samples])

