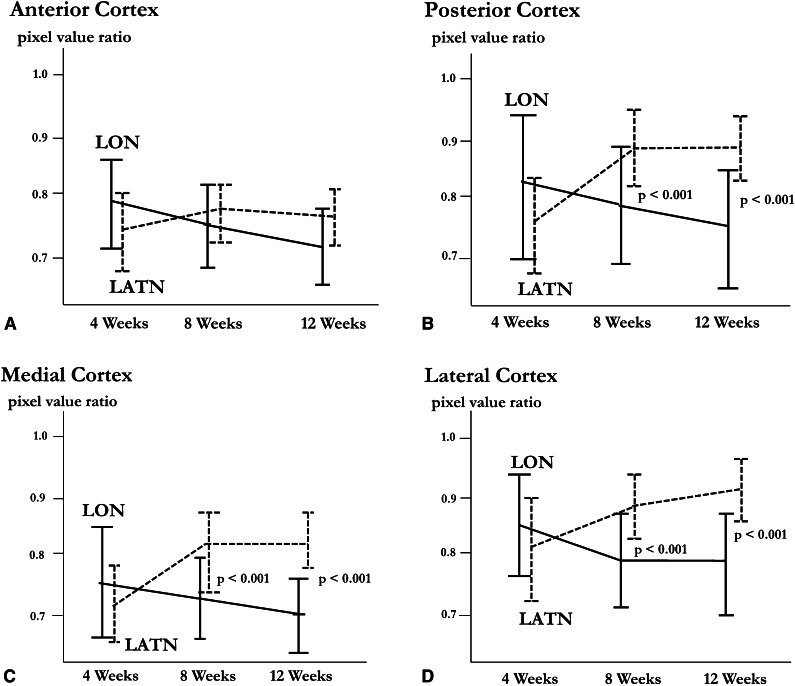
Fig. 3A–D.
Serial bar plots with the mean and 95% CI of the pixel value ratio of the anterior cortex at three times with two different surgical techniques are shown for the (A) anterior, (B) posterior, (C) medial, and (D) lateral cortices. The pixel value ratio showed no significant differences at each time for the anterior cortex. For the posterior, medial, and lateral cortices, the pixel value ratios showed significant differences at 8 and 12 weeks postoperatively, with better healing in the LATN group. LON = lengthening over nail; LATN = lengthening then nailing.

