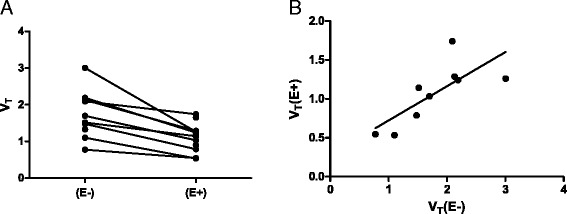
Fig. 2.

Tumor V T values. V T values of all patients without and with erlotinib therapy (a). Correlation between V T with and V T without erlotinib therapy (b). Abbreviations: V T volume of distribution, E− without erlotinib therapy, E+ with erlotinib therapy
