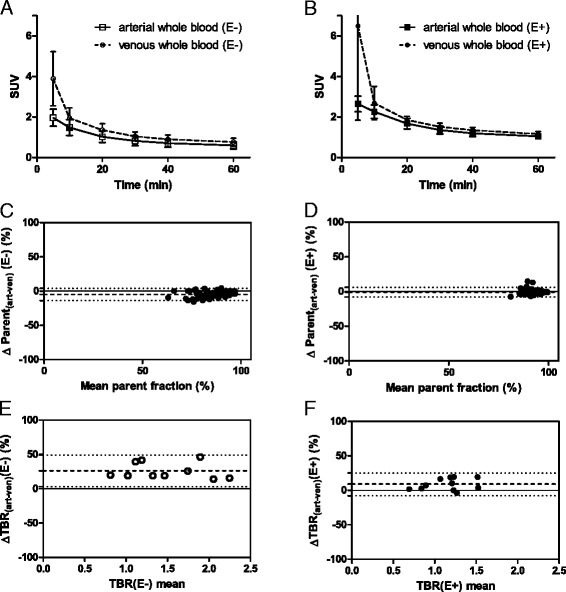
Fig. 6.

Arterial and venous sampling. Whole blood SUVs (mean ± SD) obtained from venous and arterial samples, in patients off (a) and on (b) erlotinib therapy. Bland-Altman plots demonstrating the arterial-venous parent fraction difference (%) per mean parent fraction value in patients off (c) and on (d) erlotinib therapy. In patients(E−) and patients(E+), a bias of −4.8 ± 4.6 and −0.7 ± 3.5 % was seen, respectively. Dotted lines indicate the mean bias and the 95 % limits of agreement. Next, Bland-Altman plots demonstrating the arterial-venous TBR40–50 difference (%) per mean V T value, in ten patients(E−) (e) and 11 patients(E+) (f) that had evaluable arterial and venous TBR values. The horizontal line indicates zero difference between arterial and venous TBR40–50 measures, values above the zero difference line indicate lower venous TBR40–50 values (i.e., an underestimation). In patients(E−) and patients(E+), a bias (i.e., average of the differences) of 26 ± 12 and 9 ± 9 % was seen, respectively. Dotted lines indicate the mean bias and the 95 % limits of agreement. Abbreviations: TBR tumor-to-blood ratio, SUV standardized uptake value, E− without erlotinib therapy, E+ with erlotinib therapy
