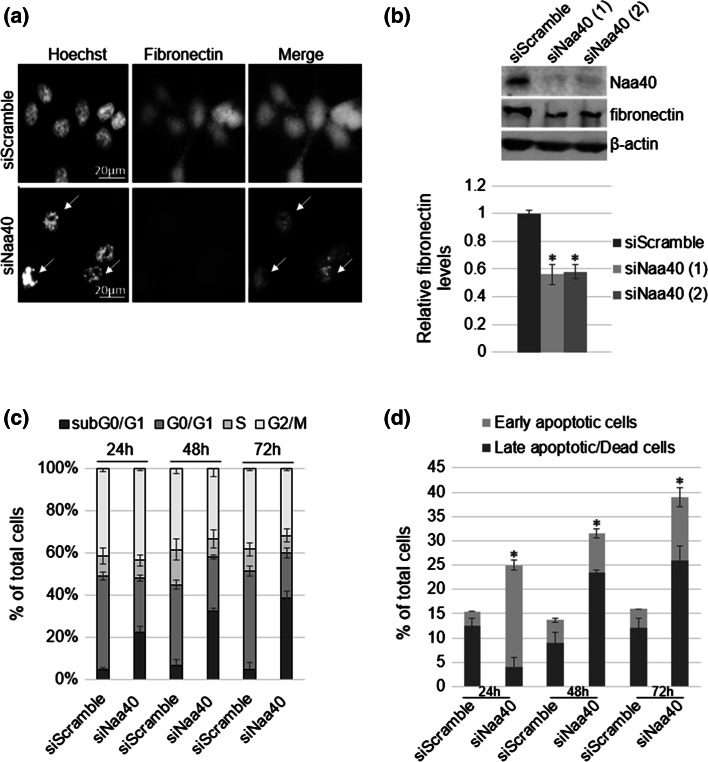
Fig. 2.
Depletion of Naa40 induces apoptosis in HCT116 cells. a Representative immunofluorescence pictures of HCT116 cells transfected with Naa40-siRNA or a scramble-siRNA for 72 h. Green-FITC staining was used against fibronectin and blue Hoechst staining was used to visualise the nuclei. Arrows indicate apoptotic cells (scale bar 20 µm). b Immunoblot analysis of fibronectin levels in the absence of Naa40 (72 h post-transfection). β-actin was used as a control. Densitometry analysis (bottom panel) shows the levels of fibronectin in siNaa40 treatments relative to the scramble-siRNA sample. c Cell-cycle analysis of HCT116 cells after treatment with a scramble-siRNA or Naa40-siRNA for 24, 48 and 72 h. d Annexin V/PI staining was used to assess the apoptotic cell population. Images in a, b are representative of three independent experiments. Statistically significant changes (p value <0.02) in b, d are indicated by an asterisk (*). The data in b–d represent the mean of at least three replicates and are representative of at least three different experiments ±SD (p value <0.02)

