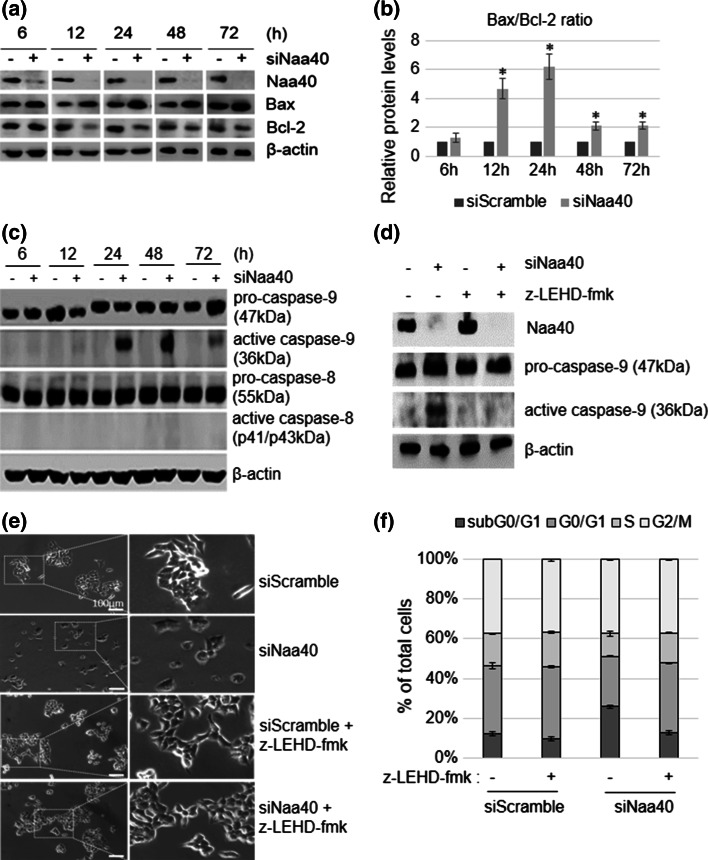
Fig. 4.
Naa40-knockdown induces the mitochondrial apoptotic pathway through activation of caspase-9. a Immunoblot analysis of untransfected (−) or Naa40-siRNA (+) transfected HCT116 cells during a timecourse of 6–72 h using antibodies against Naa40, Bax, Bcl-2 and β-actin, as a loading control. b Quantitative densitometry showing the ratio between Bax and Bcl-2 protein levels according to western blots in (a). An asterisk indicates statistically significant changes (p value <0.02). c Immunoblot analysis as in (a) using antibodies against caspase-9, -8 and β-actin. d Immunoblot analysis of HCT116 cells transfected with siScramble (−) or siNaa40 (+) in the presence (+) or absence (−) of caspase-9 inhibitor z-LEHD-fmk. Whole cell lysates were collected 48 h post-transfection and assayed using antibodies against caspase-9 and β-actin. e Representative phase contrast images from at least three independent experiments showing HCT116 cells treated as in (d) for 48 h (scale bar 100 µm). Dashed rectangles represent the zoomed-in regions that are shown on the right panels. f Cell cycle analysis of cells treated as in (d) for 48 h. Western blot images in a, c, d are representative of three independent reproducible experiments. Values in b, f represent the mean of three independent experiments ±SD (p value <0.02)

