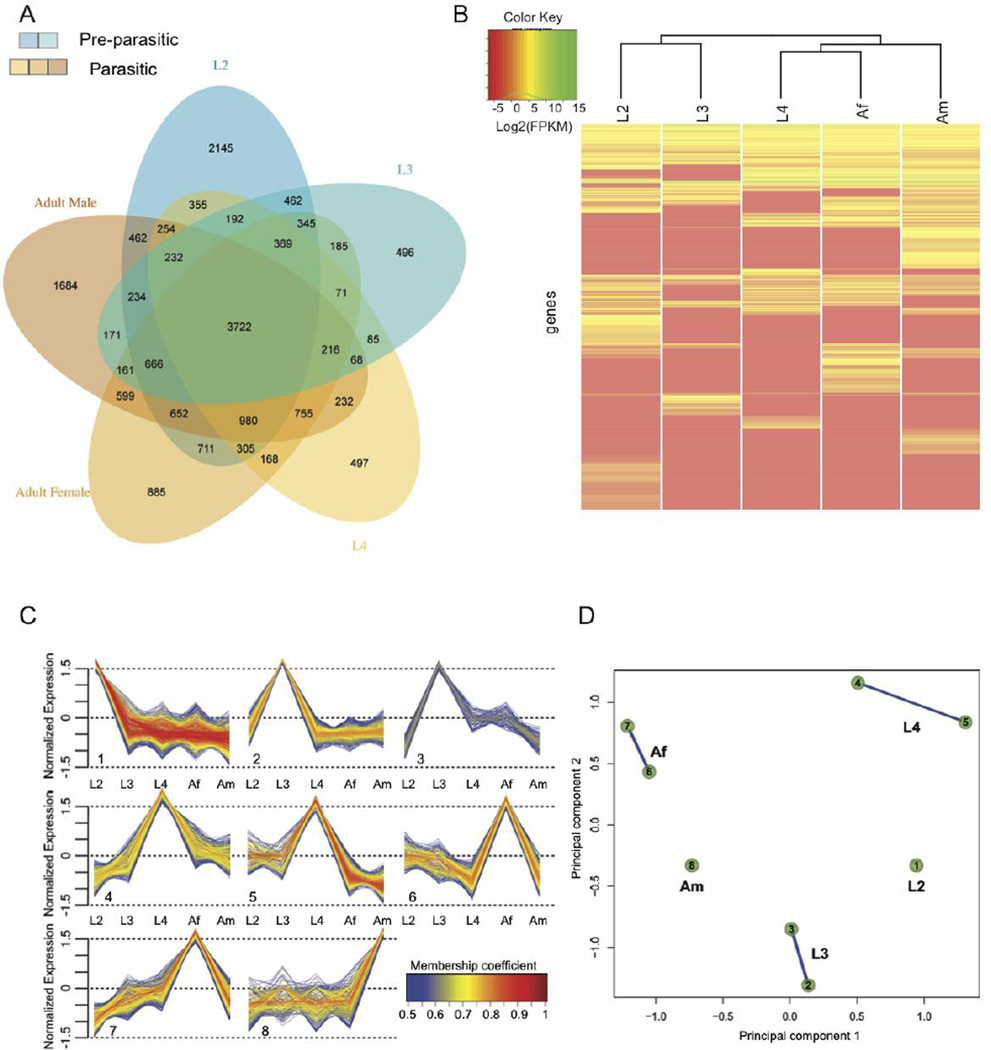
Fig. 4.
Transcription throughout the development of Oesophagostomum dentatum. (A) Venn diagram showing genes whose transcription is detected in the developmental stages assayed. Blue shades represent pre-parasitic stages; orange shades represent parasitic stages. (B) Heat map showing transcriptional levels for the genes either specific to a stage or overexpressed in a stage. Based on these, the free-living stages (L2 and L3) cluster separately from the parasitic stages (L4 and Adult stages). (C) Soft clustering of all genes with non-zero FPKM in at least 3 stages was done. Eight clusters associated into 5 different groups based on the extent of shared genes among them, each characterized primarily by having high level of normalized transcription in one of the 5 developmental stages. (D) “Cluster Overlap” panel for gene clusters presented in C. Genes that did not have >0.5 membership coefficient in any of the clusters were not assigned to any clusters and are not shown here.

