
Figure 6.
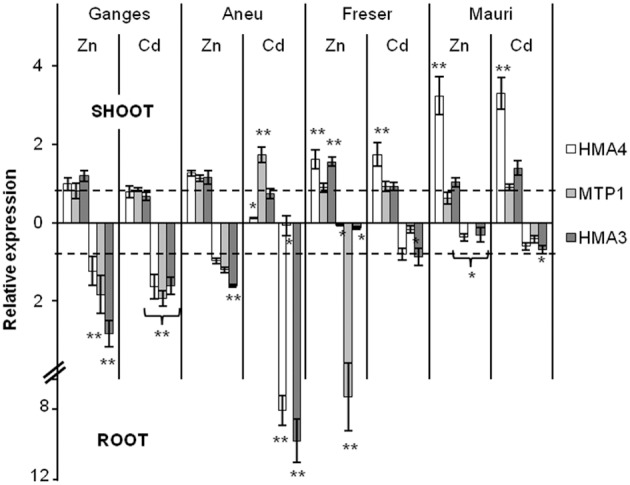
Relative expression analysis of three metal transporters according to Pfaffl method. The expression is expressed as the fold change compared to non-treated plants and normalized by tubulin gene. Plants were grown on a hydroponic system for 1 week under metal treatment of 1.5 μM CdCl2 or 100 μM ZnSO4, control plants were non-exposed to Cd or with 2 μM Zn. Shoot markers expression is represented on the top part of the graphic and root markers expression on the bottom part. Dotted lines mark similar expression (fold change around 1) for treated and control plants; double asterisk indicates over-expression (≥ 1.5) and single asterisk indicates down-regulation (≤ 0.5).