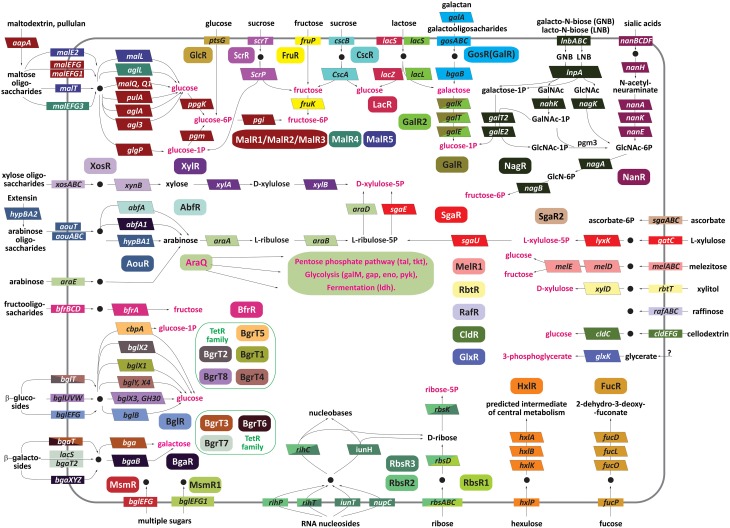
Figure 1.
Carbohydrate utilization pathways involved in the reconstructed transcriptional regulatory network in bifidobacterial genomes. The regulators are denoted by ovals; transporters are shown by rectangles, and enzymes are shown by bent rectangles. The genes regulated by the same TF are shown by matching background colors. The genes that are regulated by two different regulators are colored by both colors in diagonal segments. Common intermediates of the central carbohydrate metabolism are shown in red. Note that none of the individual Bifidobacterium species contain all of the shown pathways. The utilized compounds transported into the cell are depicted by black circles.

