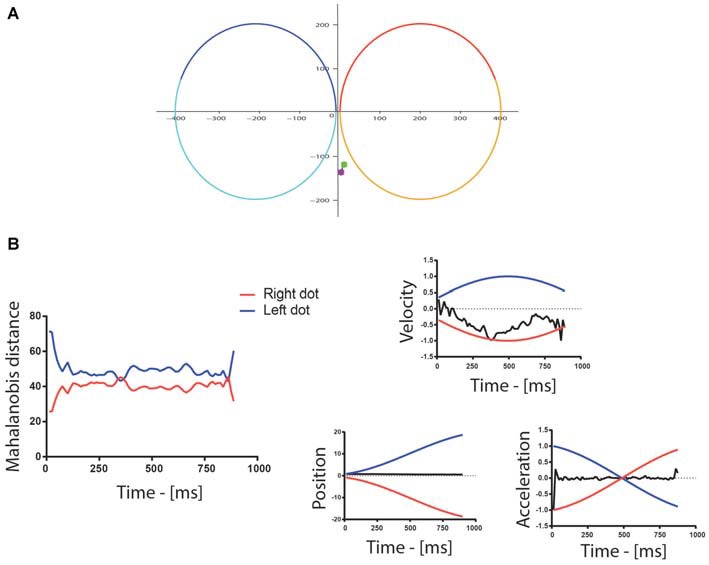
Figure 2.

(A) Example of eye movements during a trial: the colored spots represent the beginning (green) and end (purple) of the eye trace. In this particular example, the position of the eyes changed little throughout the trial. The red/orange and the blue/cyan traces are the paths of the two dots for the first/second part of the trial. (B) The graph to the left shows the Mahalanobis distance between the eyes and the dots following the left (blue) and right (red) trajectories/paths in the first half of the trial. The Mahalanobis distance with the two dots was relatively large in this particular trial (around 42) because the position and acceleration profiles of the eyes differed strongly from the ones of the dots, as shown on the graphs on the right of the figure, which illustrate the normalized velocity, the position and the normalized acceleration of the dots (blue—left, red—right) and gaze (black). The position is reported in pixel, whereas the trial-wise normalization of velocity and acceleration was performed by dividing all values by the maximum of their absolute value. The velocity of the gaze, however, followed more closely the velocity of the right dot, which indicated attention allocation to the right in this example trial.
