
Figure 3.
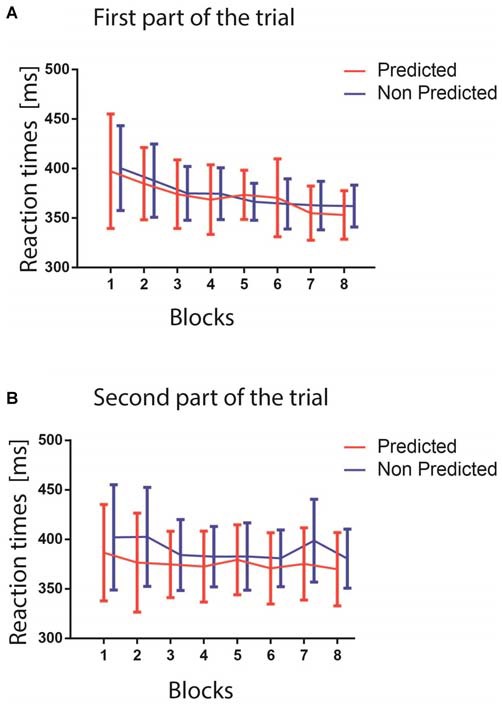
(A) The upper figure shows the reaction times (RTs) in ms for the two predictability conditions in the first part of the trials (red predicted colors, blue unpredicted colors). The blocks are represented on the x-axis. (B) The lower figure shows RTs as a function of the blocks for the second part of the trials (red predictable colors, blue unpredictable colors). In both panels, error bars represent standard errors of the mean computed within each block.