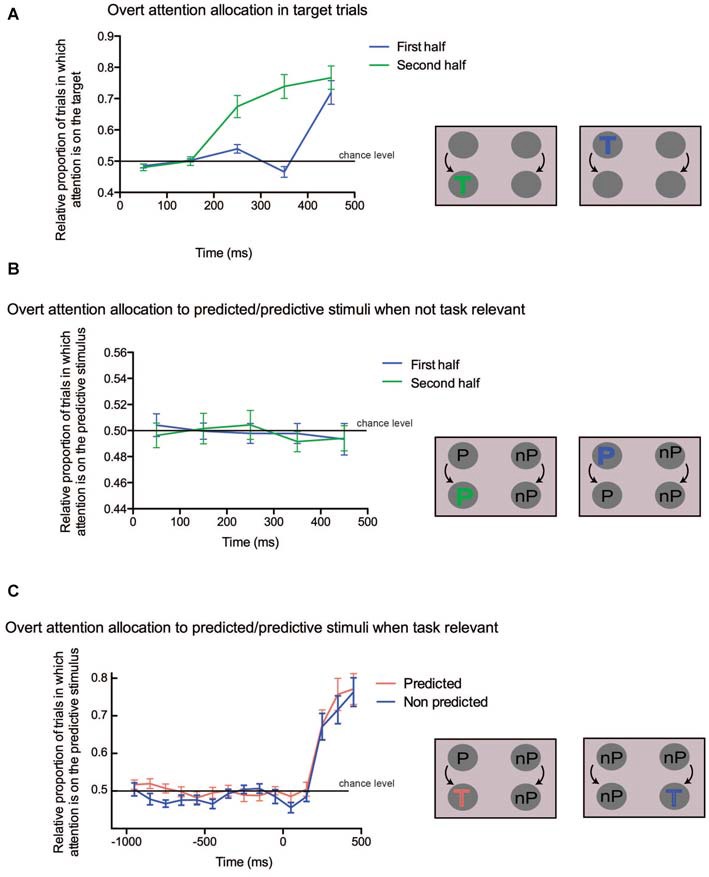
Figure 4.

(A) Overt attention allocation for the trials in which a target occurred either in the first half (blue line) or in the second half (green line) of the trial. Time is shown along the x-axis, the proportion of trials in which targets attracted attention is on the y-axis. The 0 value on the x axis corresponds either to the beginning of the trial (first half) or to the change of color (second half). A schematic depiction of the analyzed conditions is shown on the right. The target could appear either in the first part (blue “T”) or in the second part (green “T”). (B) Overt attention allocation to predicted/predictive stimuli when not task-relevant. On the x-axis time is in ms, on the y-axis the proportion of trials in which predictive colors attracted attention is shown, indicated as the difference between the predicted and the non-predicted dots. A value of 0 on x-axis corresponds either to the beginning of the trial (first half) or to the change of color (second half). On the right, the predicted (“P”) and non predicted (“nP”) conditions are illustrated. (C) Overt attention allocation to the predicted stimulus when task relevant. On the x-axis time is in ms, while on the y-axis there is the relative proportion of trials in which attention is captured by the predictive stimulus when the target is either predictive or not. A value of 0 on the x-axis corresponds to the time of the change of color. The two conditions are illustrated on the right of the panel: in the first case the target is preceded by a predictive color (red “T”), whereas in the second case the target is preceded by a non-predictive color (blue “T”).
