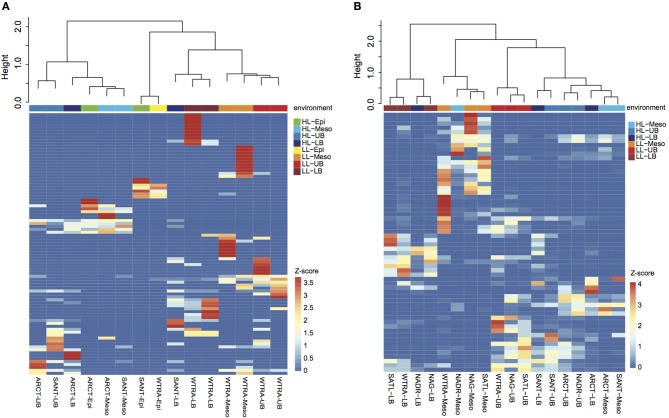
Figure 5.
Heatmap visualizing the z-score distribution of the different oligotypes obtained by Sanger sequencing (A) and pyrosequencing (B) among the samples collected in the Atlantic Ocean. The dendogram clusters samples according to the Bray-Curtis similarity index. Samples are colored according to the environment, HL, high latitude (>40°); LL, low latitude (< 40°); and depth layer.

