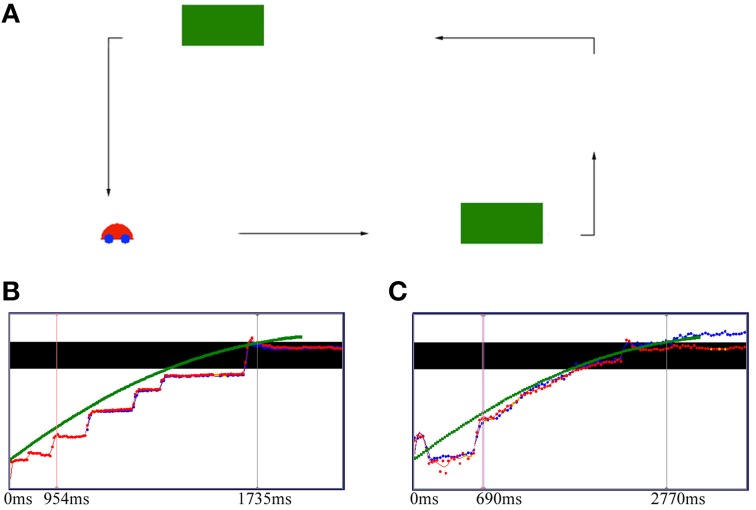
Figure 1.
Occlusion experimental set-up (A), and gaze data (↑ position and → time) for a typical slow deceleration in a 4-month-old infant (B) and a 12-month-old infant (C). (A) The car traveled horizontally on a rectangular path under one of three deceleration conditions, fast (10% deceleration), medium (50% deceleration), and slow (90% deceleration). The two green boxes temporarily occluded the car from its path of travel. (B,C) The black bar represents the occluder, and the green squares represent the car motion, while the red and blue dots represent the right and the left eye, respectively. Yellow dots are missing data. The left markers in each graph represent the catch up event (the moment at which the horizontal eye velocity equals the speed of the car for the first time), while the right markers represent the point in time at which the car starts to reappear from behind the occluder. The 4-month-old infant shows typical saccadic tracking to keep up with the target motion (B), whereas the 12-month-old infant follows the car with smooth pursuit (C). The 12-month-old infant shows an anticipatory saccade to the end of the occluder before car reappearance, while the 4-month-old infant shows no such prospective eye movement.

