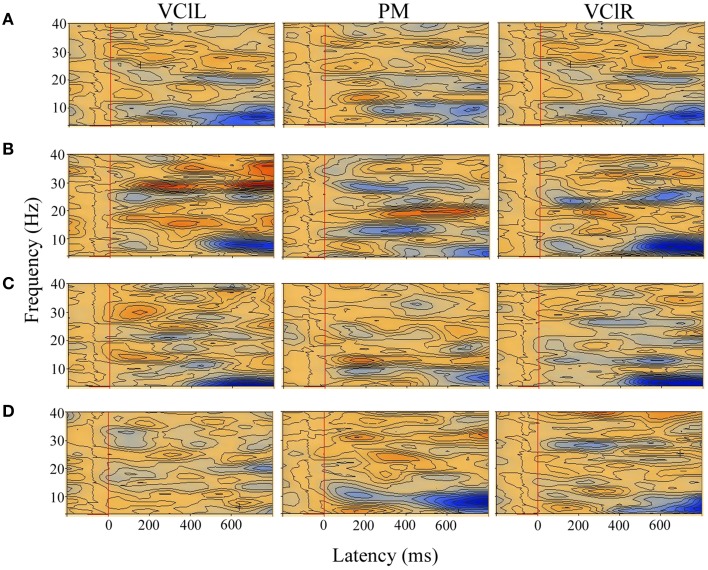
Figure 4.
TSE plots across brain regions of interest (VClL, visual cortex lateral left; PM, parietal midline; VClR, visual cortex lateral right) when the motion conditions were compared with the static non-flow condition in a typical full-term infant at 4 months (A) and 12 months (B), and in a typical preterm infant at 4 months (C) and 12 months (D). Induced synchronized and desynchronized activities appear in red and blue colored contours, respectively. Induced theta-band desynchronized activities were observed in all the visual areas of interest in the full-term and preterm infants at both ages, with induced alpha-beta band synchronized activities observed in two or more visual areas only in the full-term infants at 12 months. Stimulus onset is the vertical red line at 0 ms, with epoch from −200 to 800 ms.

