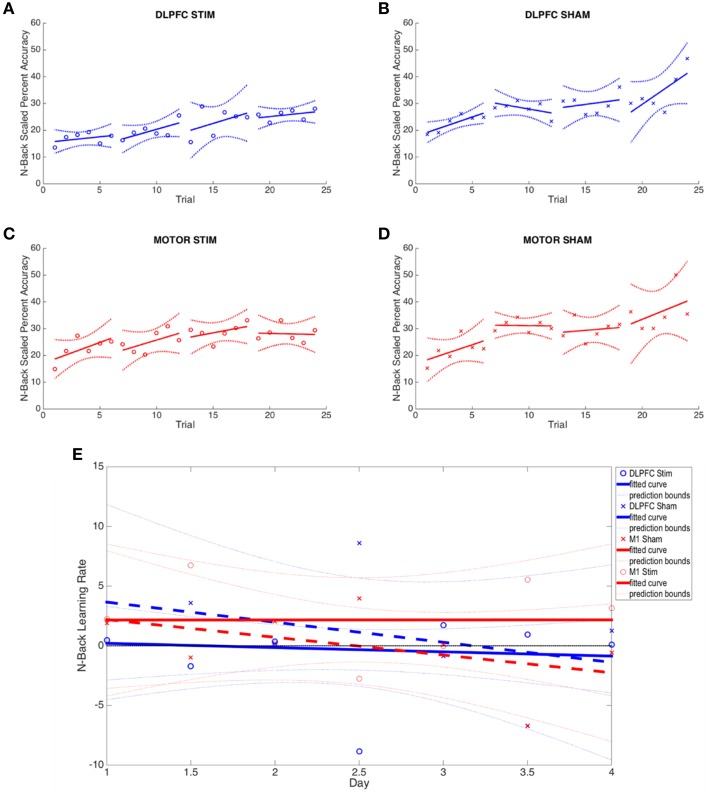
Figure 4.
N-back results across all four experimental groups. (A–D) The average percent correct is plotted across all 4 days (6 trials per day) for each group. Percent correct values are scaled based on the required information for a 100% correct response (see Section N-Back). (E) Online and offline N-back learning rates are plotted for each experimental group across the duration of the experiment. Whole numbers on the x-axis represent the average online learning rate (slope of scaled percent correct linear regression for each subject across 6 blocks within a day and numbers of the x-axis represent offline learning rates (slope of the percent correct on the last trials of the N-1 day to the first trial of the Nth day).

