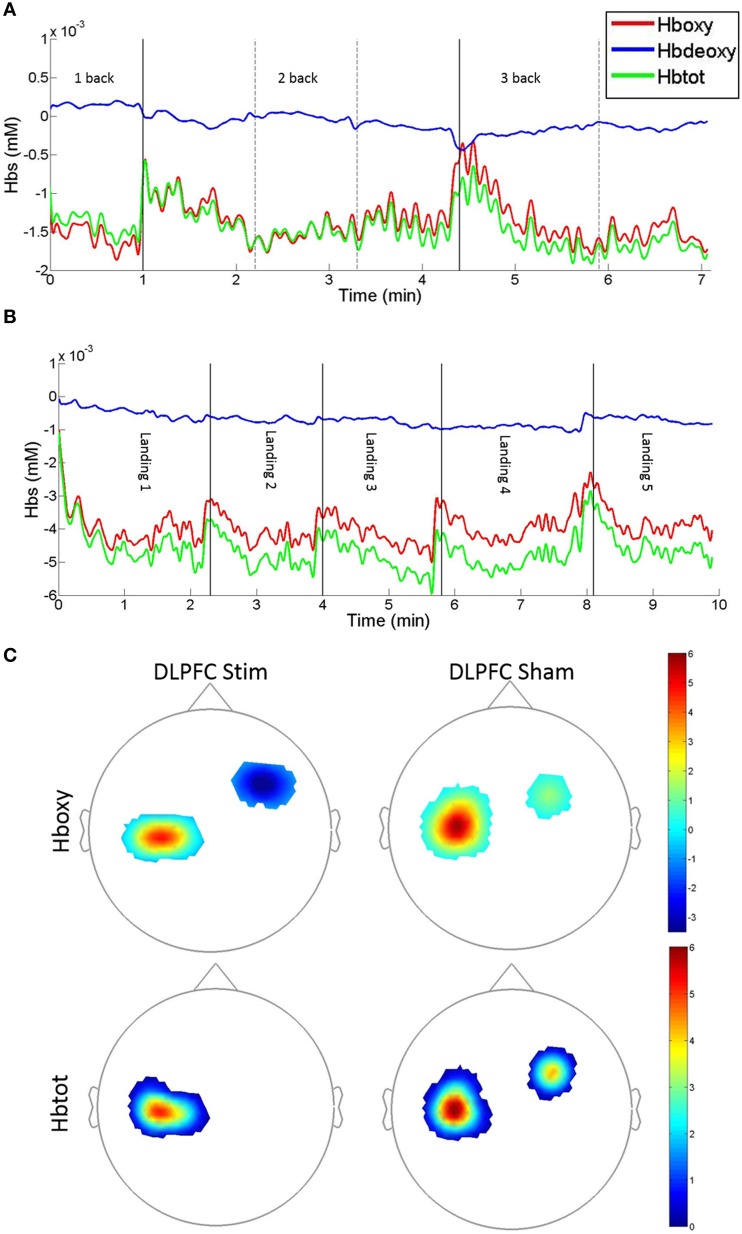
Figure 7.
Example fNIRS Hboxy, Hbdeoxy, and Hbtot concentration time-series and group average t-statistic beta maps. (A) N-back concentration time series for DLPFC sham subject #S6 recorded on day 1. Traces denote DLPFC channel #10: source: FC4, detector: F4. (B) Easy landing blocked concentration time series for DLPFC stim subject #S1 recorded on day 1. Traces denote DLPFC channel #5: source FFC6h, detector: F4 [vertical solid and dotted lines denote blocks, solid lines indicate 1/2 and 2/3-back block types in (A), and easy landing trials in (B)]. An upward displacement in Hboxy and Hbtot concentrations can be seen during pauses between subsequent blocks. (C) fNIRS t-statistic beta maps of Day 4 vs. Day 1 Hboxy (top) and Hbtot (bottom) in the Easy landing task. Images are the averages for the DLPFC stim (left) and DLPFC sham (right) groups (Bonferroni corrected p < 0.0025, see Table 2 for the corresponding concentration changes averaged over all channels within M1 and DLPFC).

