Figure 1.
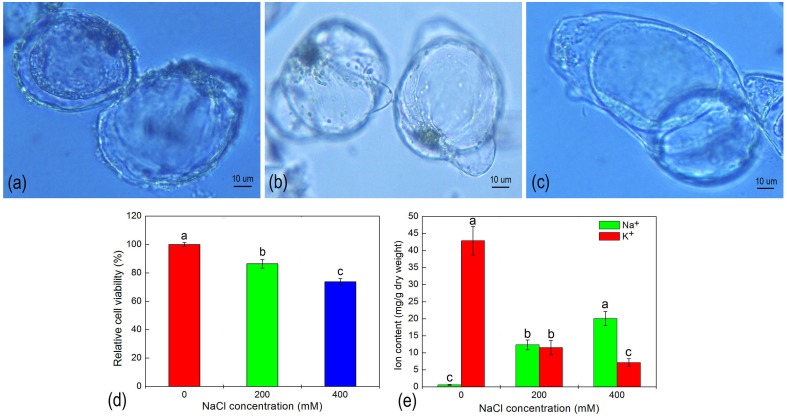
The morphology (A–C), relative cell viability (D), and ion content (E) of H. glomeratus cells after treatment with different concentrations of NaCl for 5 d. (A) 0 mM NaCl; (B) 200 mM NaCl; and (C) 400 mM NaCl. Values are expressed as the mean of three replicates ± standard error (SE). Means with the different letters indicate significant differences between different NaCl treatments according to Duncan's multiple range tests t (p < 0.05).

