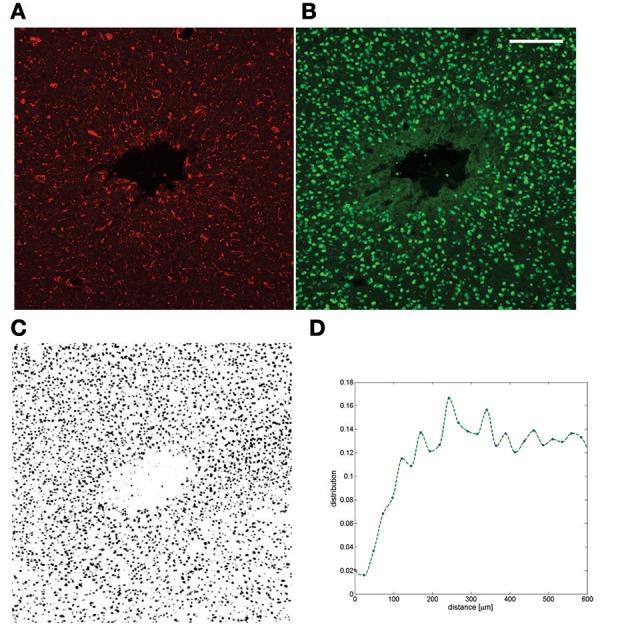
Figure 2.

Example of a chronic neuroinflammatory response to implantation of a silicon probe. (A) GFAP staining after 6 weeks of implantation in tethered configuration; (B) NeuN from the same section (C) The full NeuN image was thresholded and the area fraction is plotted as a function of distance (Prodanov and Verstreken, 2012) to the insertion track (D). The neuronal cell gap is clearly visible. The dataset was published in Welkenhuysen (2011). Scale bar—200 μm.
