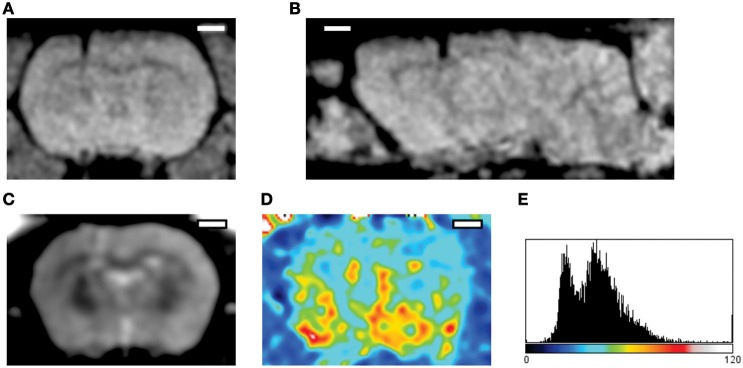
Figure 4.
Imaging of the acute post-implantation phase. The MRI datasets were acquired 24 h following implantation of a silicon probe in the rat cortex (Prodanov et al., 2009). (A,B) FLASH 3D sequence. Parameters: echo time 12 ms inversion time 100 ms 30° flip. (A) Coronal projection, (B) Sagittal projection across the implantation site; The images exhibit some hypermagnetic signal around the implant artifact (hypomagnetic dark shade). (C) Multi Spin Multi Echo (MSME) sequence, for every coronal plane—8 echo times every 10 ms (D) T2 relaxation map computed from the sequence; implantation region (left) exhibits higher T2 times that the contralateral cortex. (E) Distribution of T2 times, abscissa—ms. T2 latency times follow bimodal distribution indicating the presence of water (higher peak) and solid tissue (lower peak) (Qiao et al., 2001). Scale bars—2 mm.

