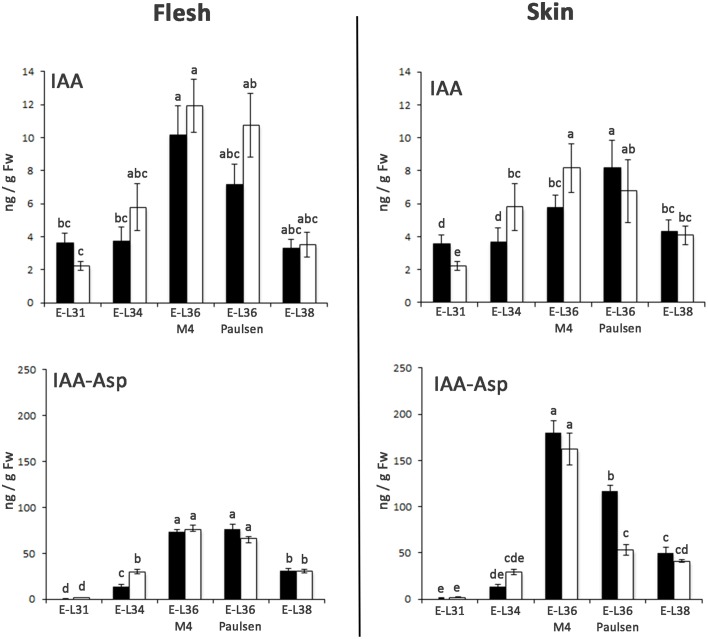
Figure 5.
Changes in levels of free IAA and IAA-Asp in flesh and skin of berries sampled from both 1103P/CS (solid bars) and M4/CS (empty bars) graft combination in 2011. IAA and the IAA-Asp were quantified by mean of LC-MS/MS at E-L31, E-L34, E-L36 M4, E-L36 Paulsen, and E-L38 developmental stages. Bars indicate SE of four replicates. Mean followed by the same letters are not statistically different at P = 0.05 (Duncan's multiple-range test).

