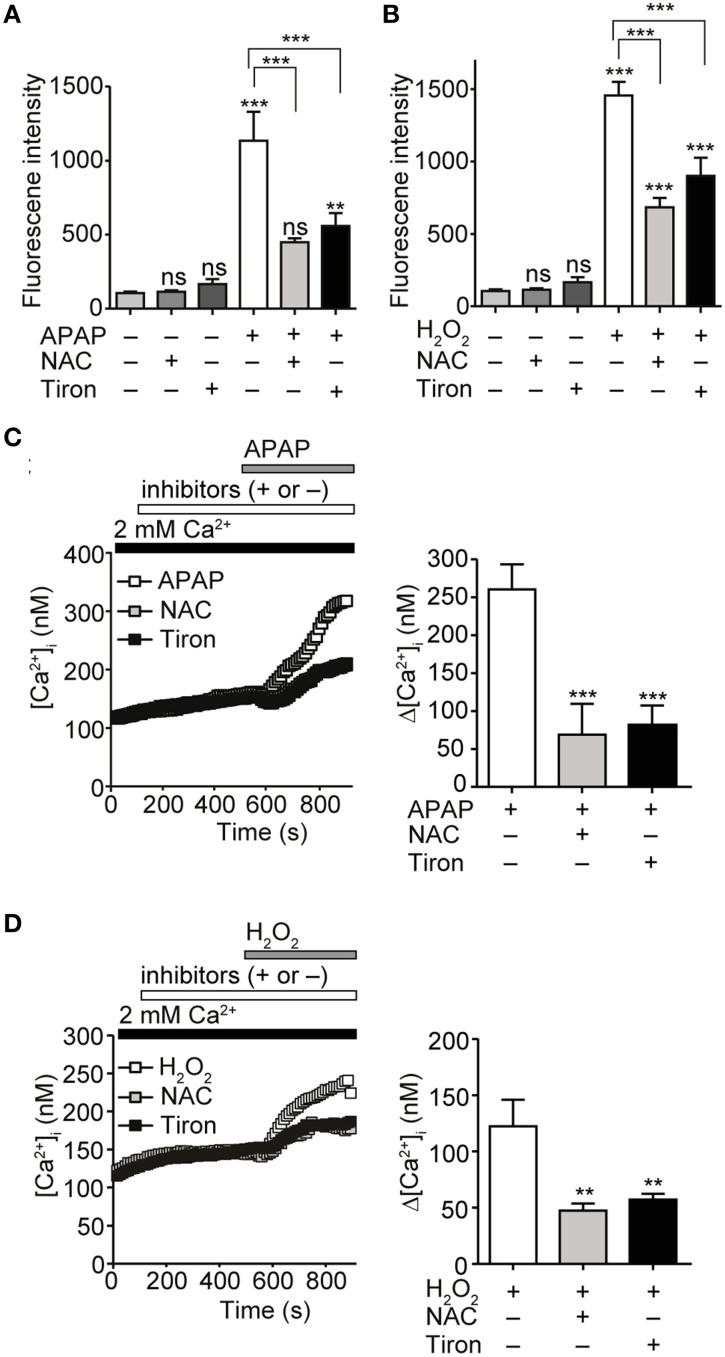
Figure 2.
Attenuation of APAP- or H2O2-induced ROS production and Ca2+ responses by ROS scavengers in HepG2 cells. (A) Suppression of ROS levels induced by APAP (20 mM) treatment for 3 h by either N-acetyl-L-cysteine (NAC) or tiron (1 mM). (B) Suppression of ROS levels induced by H2O2 treatment (1 mM) for 3 h by either NAC or tiron (1 mM). (C) Effects of either NAC or tiron (1 mM) on APAP (20 mM) induced-[Ca2+]i responses in HepG2 cells. Average time courses (left) and Δ[Ca2+]i (right) (n = 24–62). (D) Effects of either NAC or tiron (1 mM) on H2O2 (1mM) induced-Ca2+ entry in HepG2 cells. Average time courses (left) and Δ[Ca2+]i (right) (n = 19–33). ROS scavengers are applied for 3 h before and during APAP or H2O2 stimulation. Data points are mean ± SEM. P ≥ 0.05, **P < 0.01, and ***P < 0.001. Differences not statistically significant are labeled as (ns). All data of [Ca2+]i measurements were analyzed by Student's t-test, while those of ROS measurements were analyzed by ANOVA and Bonferroni post-hoc.

