Figure 6.
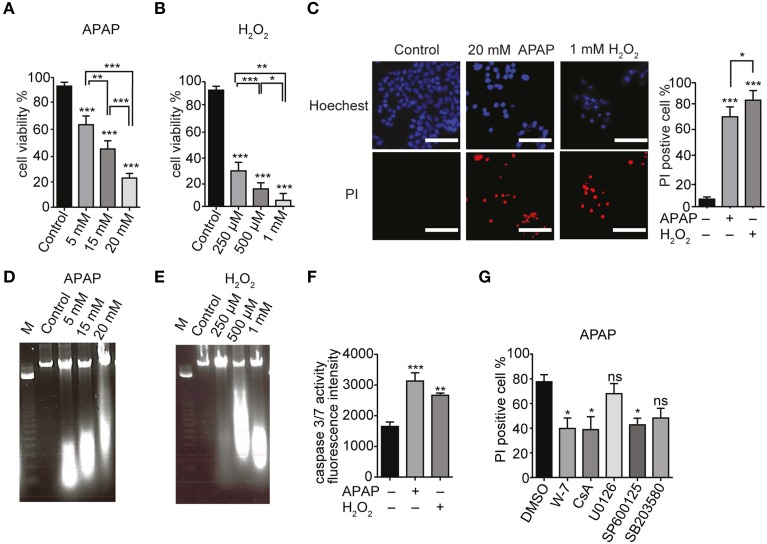
APAP-induced HepG2 cell death. (A,B) Dose dependence of viabilities of HepG2 cell treated with APAP (A) or H2O2 (B) for 24 h. Cell viability is presented as percentage of viable cells in trypan blue exclusion assay. (C) HepG2 cell death upon exposure to 20 mM APAP or 1 mM H2O2 for 24 h. Hoechst33342- and propidium iodide (PI)-staining were visualized by fluorescence microscopy. Scale bar, 100 μm. (D,E) DNA fragmentation in HepG2 cells. Cells were exposed for 24 h to APAP (D) (5, 15, and 20 mM) or H2O2 (E) (250 μM, 500 μM, and 1 mM). M is the DNA marker. (F) Caspase 3/7 activity in HepG2 cells stimulated with 20 mM APAP or 1 mM H2O2 for 24 h. (G) Effects of either Ca2+-calmodulin antagonist (W-7; 1 μM), cyclosporine A (CsA; 4 μM), or different MAPK-specific inhibitors (U0126, SP600125 and SB203580; 20 μM) on HepG2 cell death induced by APAP for 24 h in Hoechst33342- and PI-staining assays. Data points are mean ± SEM. P≥0.05, *P < 0.05, **P < 0.01, and ***P < 0.001 compared to DMSO or control. Differences not statistically significant are labeled as (ns). All data were analyzed by ANOVA and Bonferroni post-hoc.

