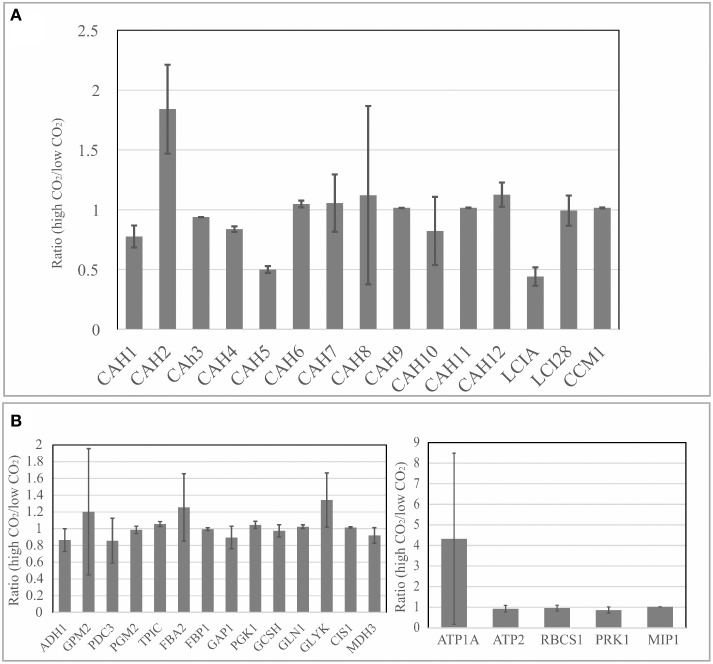
Figure 5.
Gene expression analysis through real-time qPCR. (A) Relative expression levels of genes related to carbon concentrating mechanism were compared at low (0.04%) and high CO2 concentrations (10%); (B) Expression levels of genes related to glycolysis/gluconeogenesis and Calvin cycle were compared between low (0.04%) and high CO2 concentrations (10%). Data normalization was performed using the expression level of gene coding for Actin (housekeeping gene) as reference for relative gene expression calculations. Three biological replicates were analyzed with two technical replicates. Error bars indicate standard deviation.

