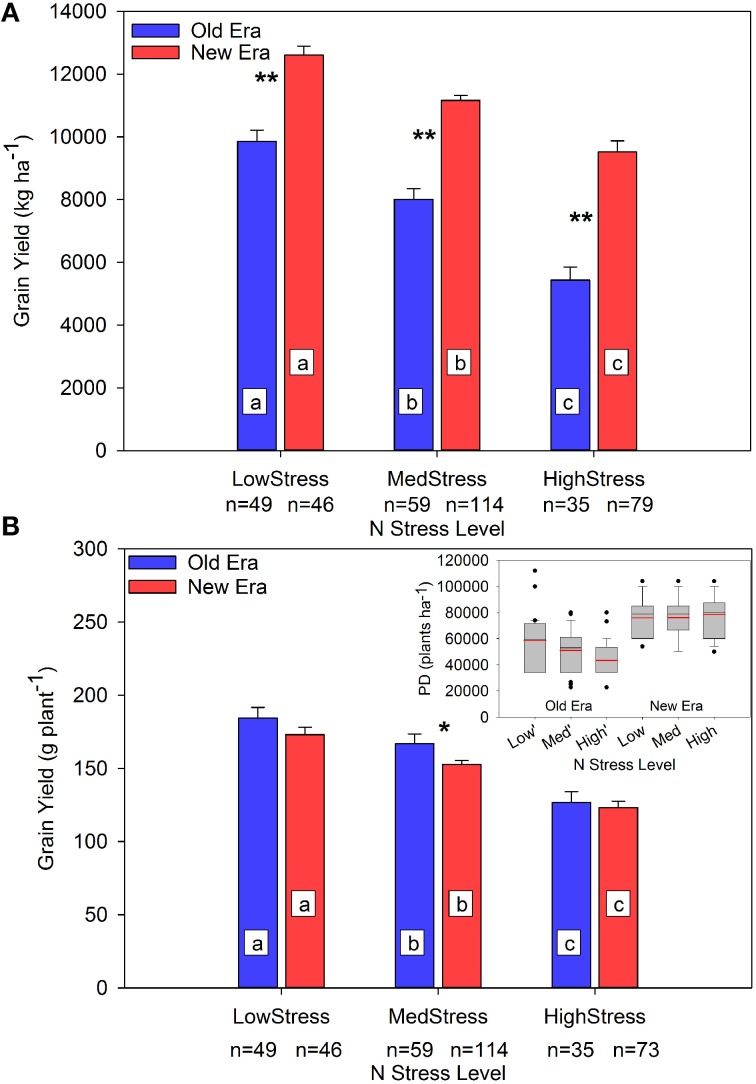
Figure 3.
Relationship between N stress level and grain yield (kg ha−1) (A) and grain yield (g plant−1) (B) across maize genotypes in the Old and New Eras as determined by R1 NNI. Different letters signify LSMeans within Eras (Old or New) are significantly different across N stress levels. An *denotes a significant difference between the Old and New Era LSMeans within a given N stress level. *denotes significance at the 0.05 probability level. **denotes significance at the 0.01 probability level. The sub-figure in panel (B) represents the distribution of plant density (PD) within each group. Black lines represent the group median PD and red lines represent the group mean PD.

