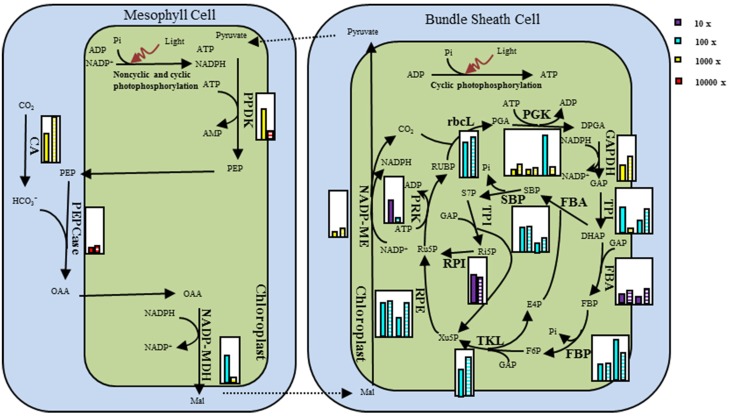
Figure 6.
Schematic view of difference in the NADP-ME type C4 pathway gene expression for M. lutarioriparius population in JH and in QG. Relative transcript abundances are given in small inset white boxes. The transcript levels were represented by the median of the population in each site. The expression values were arranged in pairs with JH in the left and QG in the right. The expression value was indicated by the product of the color and the height of the histogram. The four colors represent four scale units, while the height of histogram was relative to the height of the inset box set as 10.

