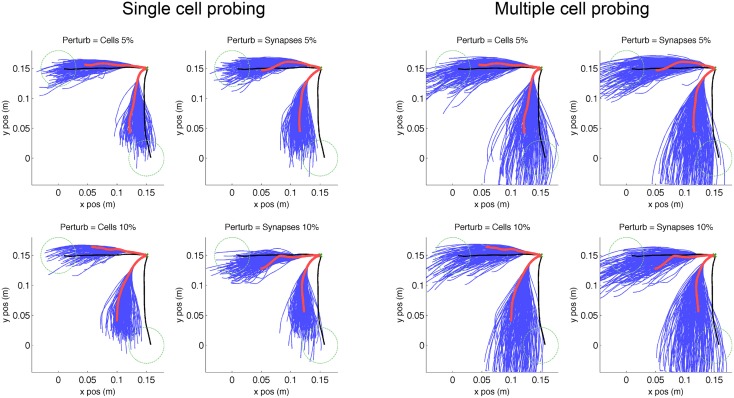
Figure 5.
Virtual arm trajectories after simulated lesion and neurostimulation probing. Original arm trajectories (black), were perturbed due to a network lesion leading to decreased reaching performance (red). A set of single cell and multiple cell probing stimulations (blue) enabled the neurocontroller to build an inverse model of the system. Data is shown for 2 targets and 4 types of perturbation. Target is indicated as green dashed circle.

