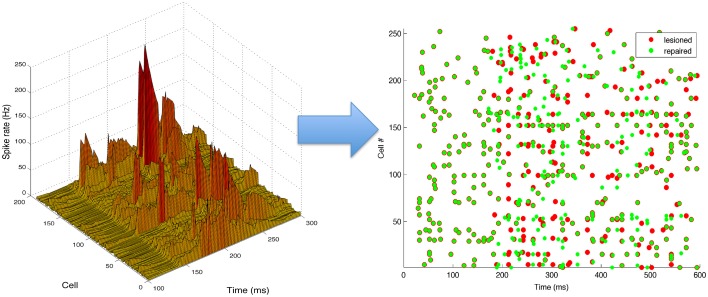
Figure 6.
Neurostimulation pattern derived by the kernel adaptive inverse neurocontroller for the 10% cell lesion of left target reaching. (Left) The pattern is represented in a continuous three-dimensional space that includes the cell number, time and intensity (rate). (Right) Raster plot of activity before (red) and after neurostimulation (green), illustrating the spiking changes derived from neurostimulation (e.g., increased rate of cell 170, from 200 to 300 ms). All S population cells (1–255) are shown, including inhibitory ones (192–255), although only the excitatory cells (1–191) can be stimulated.

