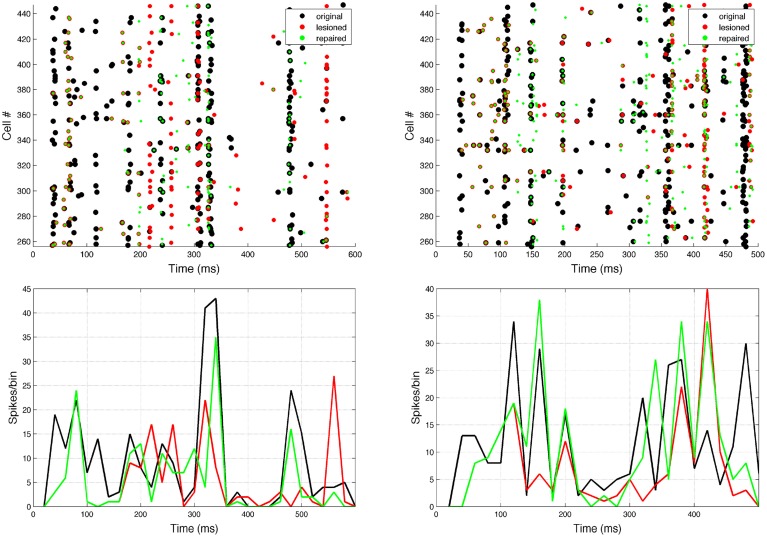
Figure 7.
Raster plot and population peri-event time histogram (PETH) of the original (black), lesioned (red), and repaired (green) motor population. Overlaps of black and green dots or lines indicate activity that has been restored via neural stimulation. Note how before the neurostimulation is delivered, the activity of the lesioned and repaired networks is identical. Two representative examples are shown: 10% cell lesion of left target reaching (left panel), and 10% synaptic lesion of bottom target reaching (right panel). Cells ids correspond to the motor population (256–511). PETH bin size is 20 ms.

