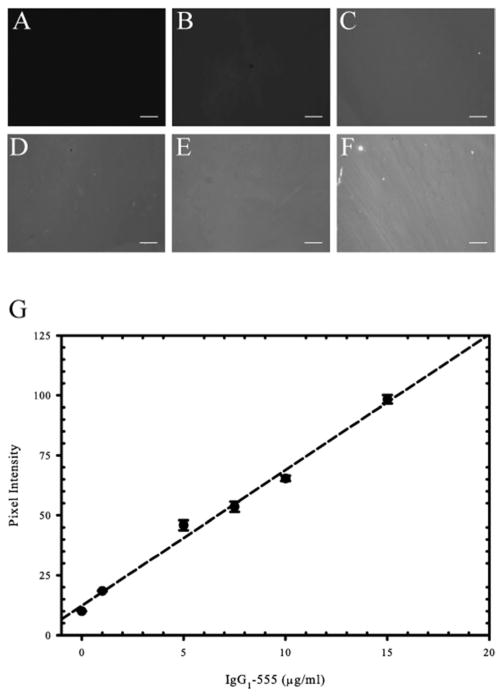
Fig. 1.
Increasing solution concentrations of Fc-containing ligand correlates to increasing surface ligand concentrations. Fluorescent images of surfaces prepared with increasing concentrations of Alexa Fluor-555 tagged human IgG1 (IgG1-555) mixed with unlabeled human IgG1 to maintain a total protein concentration of 20 μg ml−1. Solution concentrations of IgG1-555 depicted are as follows: (A) 0 μg ml−1, (B) 1 μg ml−1, (C) 5 μg ml−1, (D) 7.5 μg ml−1, (E) 10 μg ml−1, and (F) 15 μg ml−1. (G) The pixel intensities were calculated for each concentration and plotted. Data reveals a linear correlation between soluble IgG1-555 concentration and fluorescent signal present on the surface (R2 = 0.991). Scale bar = 50 μm.

