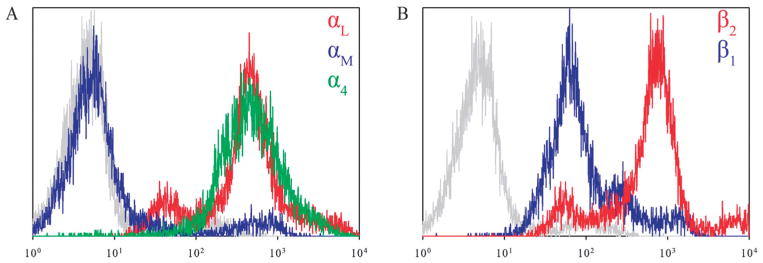
Fig. 2.
Expression of VLA-4 (α4β1) and LFA-1 (αLβ2) on primary human T-lymphocytes. (A) Expression of integrins αL (red colored line), αM (blue colored line), and the integrin α4 (green colored line). (B) Expression of integrins β2 (red colored line) and β1 (blue colored line). All negative controls are depicted in gray.

