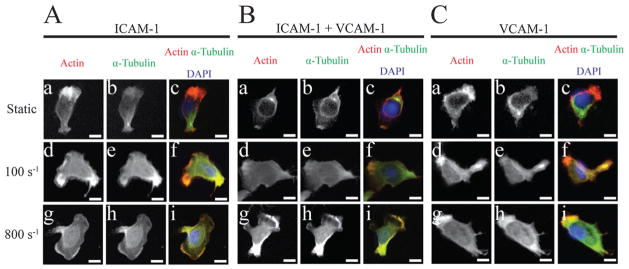
Fig. 9.
T-lymphocytes undergo cytoskeletal rearrangement upon application of shear flow during migration. (A) Fluorescent images of migrating T-lymphocytes on 5 μg ml−1 ICAM-1 under static (a–c), 100 s−1 (d–f), and 800 s−1 (g–i) shear rates. (B) Fluorescent images of migrating T-lymphocytes on 2.5 μg ml−1 ICAM-1 and 2.5 μg ml−1 VCAM-1 under static (a–c), 100 s−1 (d–f), and 800 s−1 (g–i) shear rates. (C) Fluorescent images of migrating T-lymphocytes on 5 μg ml−1 VCAM-1 under static (a–c), 100 s−1 (d–f), and 800 s−1 (g–i) shear rates. The direction of flow is from right to left. Scale bar = 5 μm.

