
Figure 4.
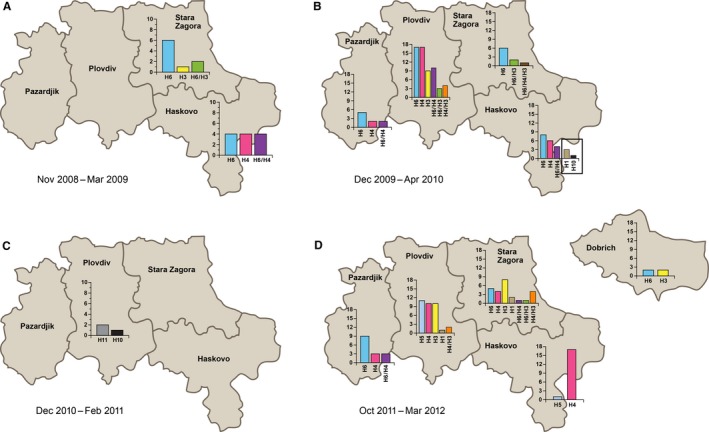
Influenza A virus subtypes detected in the ‘foie gras’ duck farms of the five monitored regions in Bulgaria during November 2008–April 2009 (A), December 2009–April 2010 (B), December 2010–February 2011 (C), and October 2011–March 2012 (D). Each IAV subtype is shown in a different color. HA subtypes are presented on the x‐axis. Dash between 2 HA subtypes represents their co‐isolation from the same pool of samples and same duck flock. Left y‐axis represents the number of isolated viruses per HA subtype.