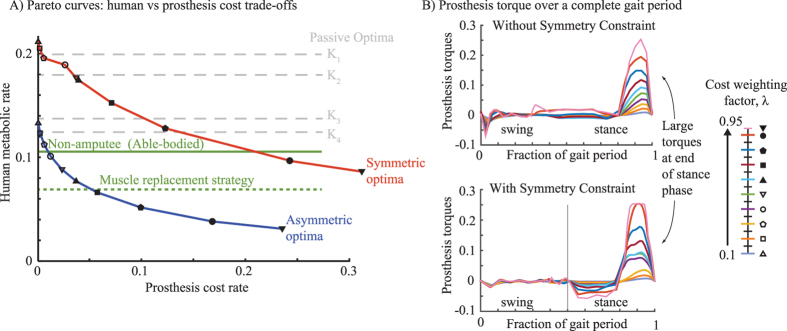
Figure 3.
(A) Optimal trade-offs (Pareto curves) between human and prosthesis costs: without symmetry constraint (blue line) and with symmetry (red line). Different markers (legend) denote results from different λ’s (0.1–0.95). Optima from passive prostheses are shown for four non-dimensional stiffnesses (gray dashed line, K1 = 0.1, K2 = 0.5, K3 = 1.0, K4 = 1.5), as are non-amputee optimum (green line) and the non-amputee optimum (green dotted line) with muscle replacement strategy (cost-free ankle muscle costs). See Figure S3 (Supplementary Information) for analogous Pareto trade-off curves for two other metabolic cost models. (B) Prosthesis torque over one stride with gait symmetry unconstrained and constrained. Each line represents an optimization with different λ (0.1–0.95). The labels ‘swing’ and ‘stance’ are left without a clear demarcation of when these phases occur, because they are different durations for the different optimal gaits when asymmetry is allowed; with symmetry, each of these phases is 50% of the gait period.

