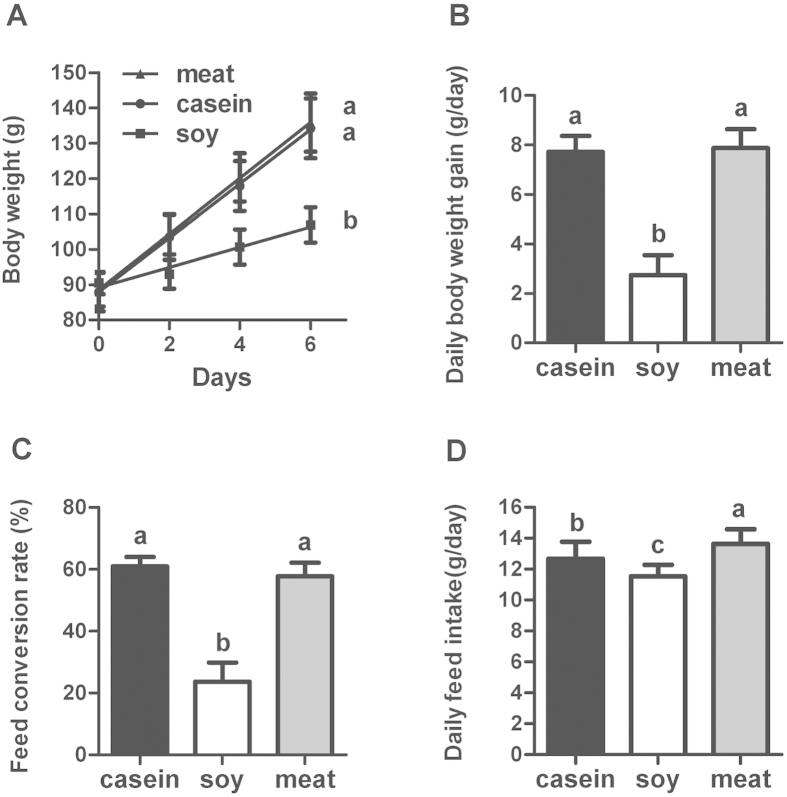
Figure 1. Growth performance of rats fed casein, soy and meat protein diets.
(A) Body weight; (B) Daily body weight gain; (C) Feed conversion rate (BWG/FI). (D) Daily feed intake. Values are shown as means ± SD. The numbers of biological repetitions of casein, soy and meat protein groups were 10, 10 and 40, respectively. For panel (A), linear regression was performed for body weight of rats. The intercept representing initial body weight of rats was not different for three groups. The slope represents growth rate of rats, and its statistical significance (P < 0.05) is illustrated by different letters on the right side of lines. For panels (B–D), different letters above bars indicate significant difference at P < 0.05 analyzed by one-way ANOVA and LSD multiple comparisons.

