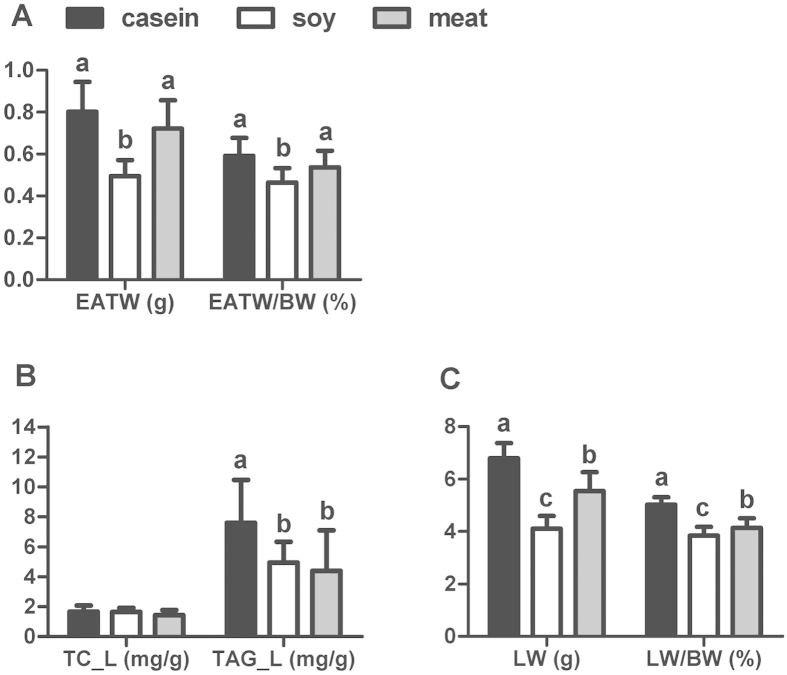
Figure 2. Adipose tissue weight, liver weight, liver TC and TAG content of rats fed casein, soy and meat protein diets.
(A) EATW: absolute weight of epididymal adipose tissue; EATW/BW: relative weight of epididymal adipose tissue to body weight. (B) TC-L: total cholesterol in the liver; TAG-L: triacylglycerol in the liver. (C) LW: absolute weight of liver; LW/BW: relative weight of liver to body weight. Values are shown as means ± SD. The numbers of biological repetitions of casein, soybean and meat protein groups were 10, 10 and 40, respectively. Different letters above bars indicate significant difference at P < 0.05 tested by one-way ANOVA and LSD multiple comparisons.

