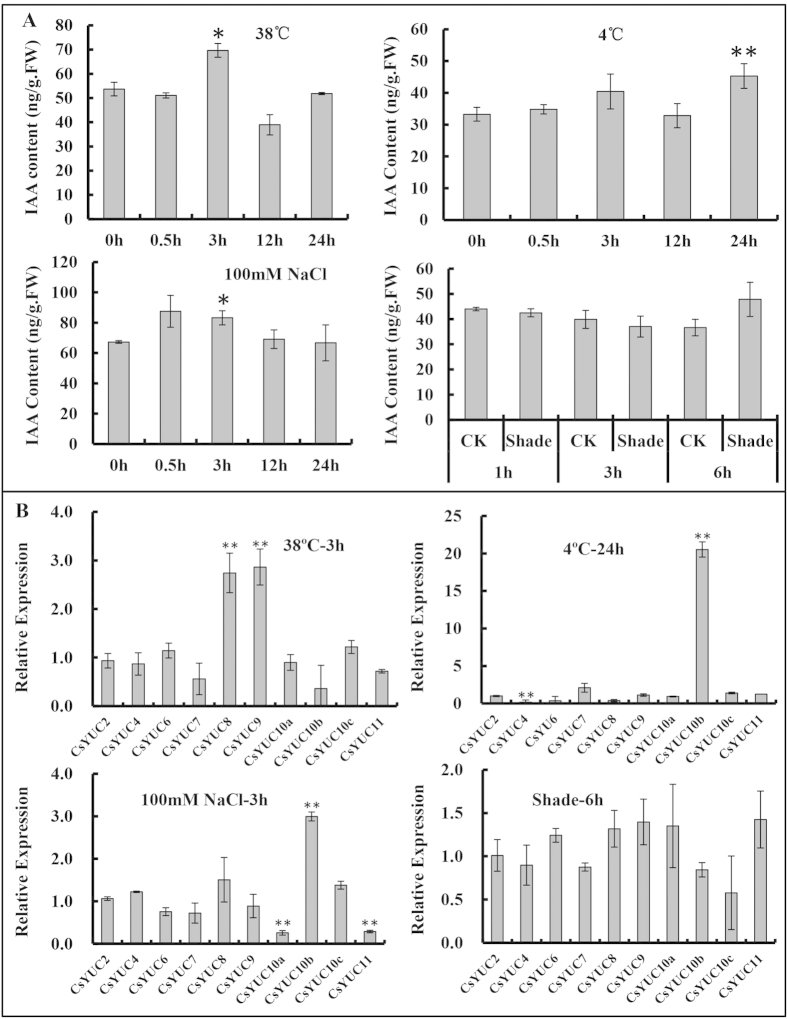
Figure 4. Endogenous IAA level and expression of CsYUCs in response to different abiotic stresses.
(A) IAA content of 21-days-old seedlings under different abiotic stresses. (B) Expression of CsYUCs in response to abiotic stresses. The bars represent the standard deviation of three biological replicates. Asterisks and double asterisks indicate significant difference between treated and untreated (0 h) control at P < 0.05 and P < 0.01 (unpaired t-test), respectively.

