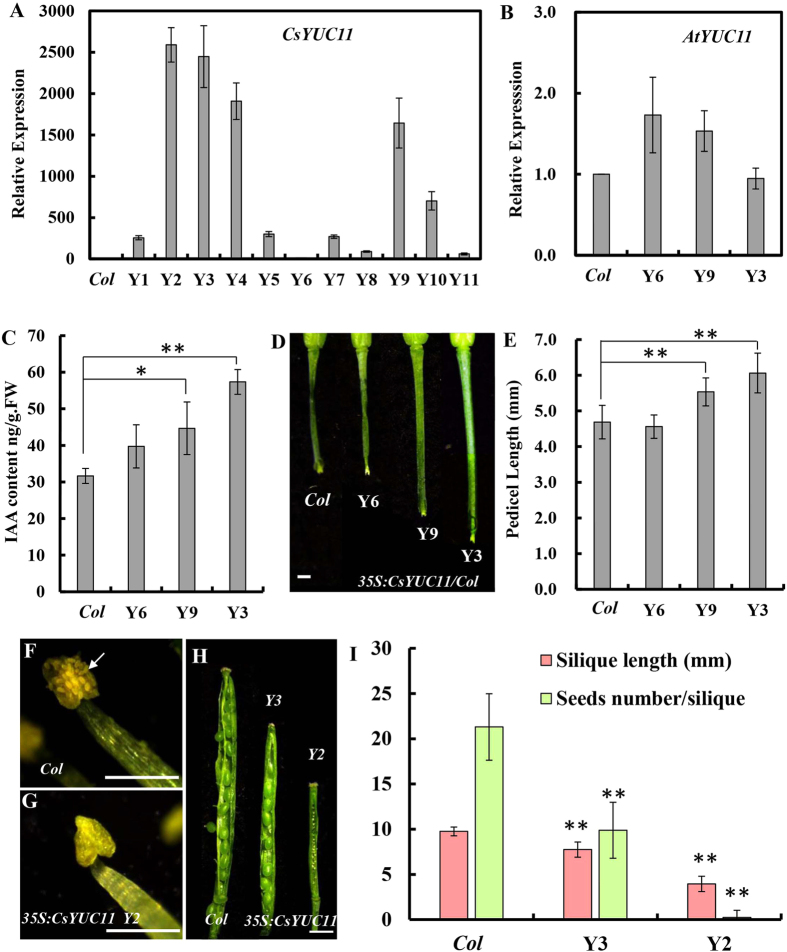
Figure 6. Ectopic expression of CsYUC11 in Arabidopsis.
(A–B) qRT-PCR analysis of CsYUC11 (A) and AtYUC11 (B) in the inflorescence apex of WT (Col) and 35S:CsYUC11 transgenic lines. (C) Endogenous IAA content of WT (Col) and three transgenic lines. (D) The fruit pedicel of Col and three transgenic lines at stage 17. (E) Quantification of pedicel length in Col and transgenic lines (n = 10). (F–G) Mature stamens in Col (F) and 35S:CsYUC11 transgenic line 2 (G). The arrow indicates the opened pollen sac. (H) The siliques of Col and 35S:CsYUC11 line 3 and 2 at the same developmental stage. (I) Quantification of silique length and seed number per silique in Col and transgenic lines (n = 12). Double asterisks indicate significant difference between Col and transgenic lines at P < 0.01 (unpaired t- test). Scale bars represent 1 mm in D and H, and 250 μm in (F–G).

