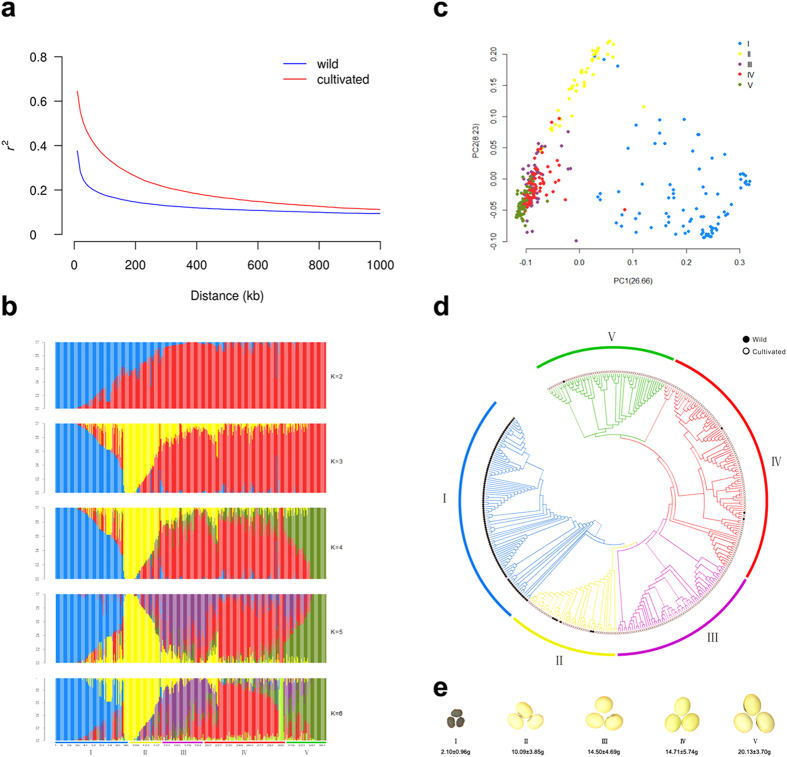
Figure 2. The population structure of 367 soybean accessions and LD decay of wild and cultivated soybeans.
(a) LD decay estimated by the squared allele frequency correlation (r2) against the distance between polymorphic sites in wild (blue) and cultivated (red) soybeans. (b) Population structure analysis of 367 accessions using ADMIXTURE. Each color represents a single population. Each vertical column represents one accession and each colored segment in each column represents the proportion contributed from ancestral populations. The numbers of clusters (K) were set from 2–6. The 367 accessions were divided into 5 groups (I–V). (c) PCA of the 367 accessions. Individuals from the same group are represented by the same color. (d) A neighbor-joining tree of the 367 accessions. (e) Variation in seed weight in soybeans. Typical seeds of each group were shown.

