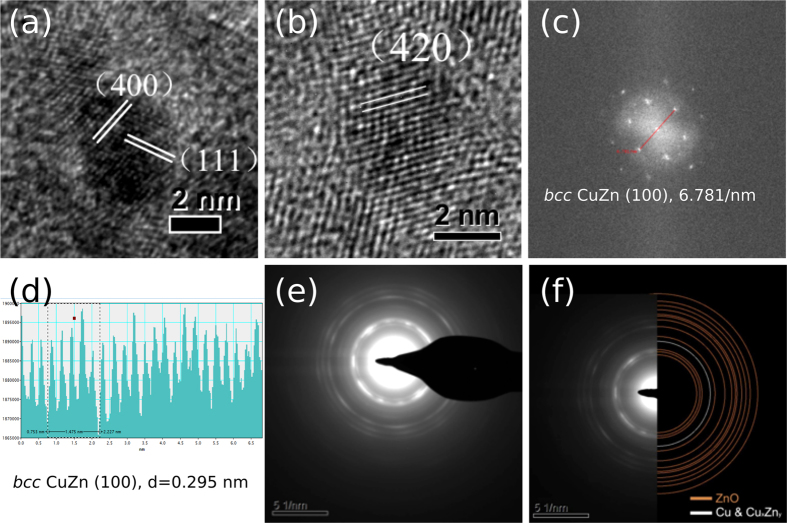
Figure 2.
Structural analysis of CZG29 sample: (a,b) HRTEM showing (400) and (420) bcc CuZn phase surrounding (111) fcc Cu nanoparticle core; (c) nano-diffraction of selected bcc CuZn phase; notice that the less well-defined diffraction spots could be arisen from the small sized and highly strained crystallite; (d) (100) phase of d = 0.295 nm; (e) selected area of diffraction rings; (f) diffraction rings matching well with simulated Braggs’ diffractions of Cu, ZnO and bcc CuZn phases.

