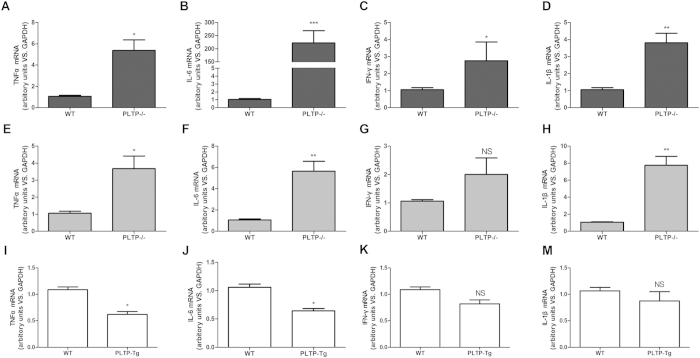
Figure 3. The expression of inflammatory cytokines in PLTP deficient macrophage induced by LPS.
(A–D) Peritoneal derived macrophage (PDM) was stimulated with LPS (200 ng/mL) for 12 h. mRNA of TNF-α, IL-6, IFN-γ, and IL-1β was evaluated with real-time PCR (showed as Dark column). Expression levels of mRNA were indicated as fold difference compared with wild type group (WT). (E–H) Bone marrow derived macrophages (BMDM) from PLTP knockout mice (PLTP−/−) or WT were stimulated with LPS (200 ng/mL) for 12 h. mRNA of TNF-α, IL-6, IFN-γ, and IL-1β was evaluated with real-time PCR(showed as Gray column). Expression levels of mRNA were indicated as fold difference compared with WT. (I–M) BMDM from PLTP overexpressed mice or WT was stimulated with LPS (200 ng/mL) for 12 h. mRNA of TNF-α, IL-6, IFN-γ, and IL-1β was evaluated with real-time PCR(showed as Gray column). Expression levels of mRNA were indicated as fold difference compared with WT. Data were expressed as the mean ± SD (n = 4). *P < 0.05 VS. WT.; **P < 0.01 VS. WT.; ***P < 0.001 VS. WT.; NS, no significance VS. WT.

