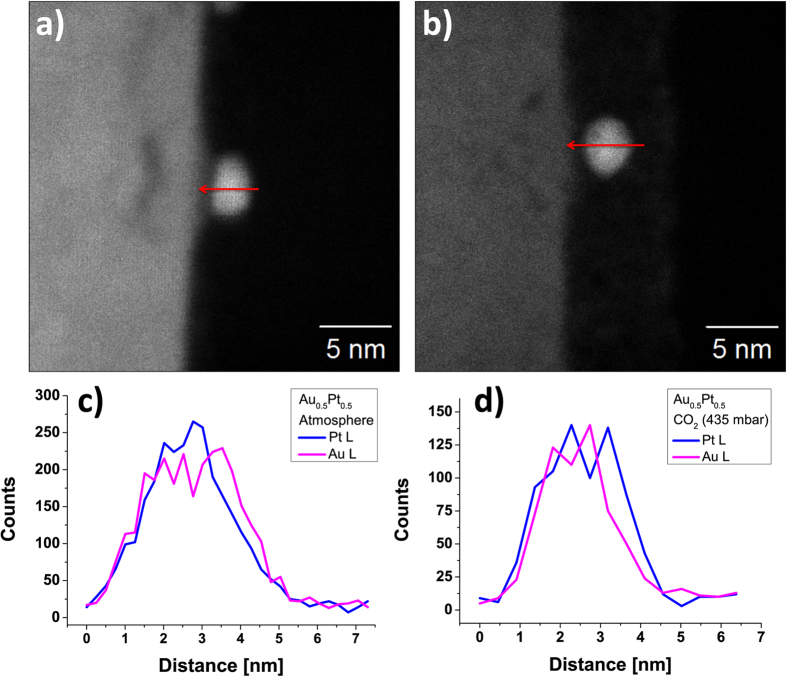
Figure 4.
HAADF image of Au0.5Pt0.5 NPs on Y:ZrO2 (100) after annealing for 22 h at 400 °C in (a) atmosphere and (b) CO2 (both 435 mbar). The samples shown in the EDX linescans (red arrow indicates the scanning direction) were annealed under (c) atmosphere or (d) CO2. They do not show any phase segregation of Au and Pt atoms after the aging process.

